

COVID-19
POCUS for COVID-19 - a review by The POCUS Atlas

Ultrasound in COVID-19
Written by Michael Macias, MD (@emedcurious), Matthew Riscinti, MD Editors: Dr. Rachel Liu, Dr. John F Kilpatrick, Dr. Tessa Damm, Dr. Tim Scheel
Last updated: June 18th, 2020 (Evidence Atlas Review)


COVID-19 Ultrasound Card
Denver Health and The POCUS Atlas have teamed up to create a COVID-19 Ultrasound protocol. These will be printed on plastic and will distributed to providers. This is FOAMED: Click to download a PDF version or contact Matthew Riscinti, MD for an Adobe Illustrator source file if you want to adapt this for your own institution. Our cleaning protocol is also available at that link.
We believe that collaboration and human-centered design will tackle the biggest problems in healthcare. The contributors to the card include, in no particular order: Matthew Riscinti, MD, Michael Macias, MD, Tim Scheel, DO, Paul Khalil, MD, Amanda Toney, MD, Molly Thiessen, MD, and John Kendall, MD.
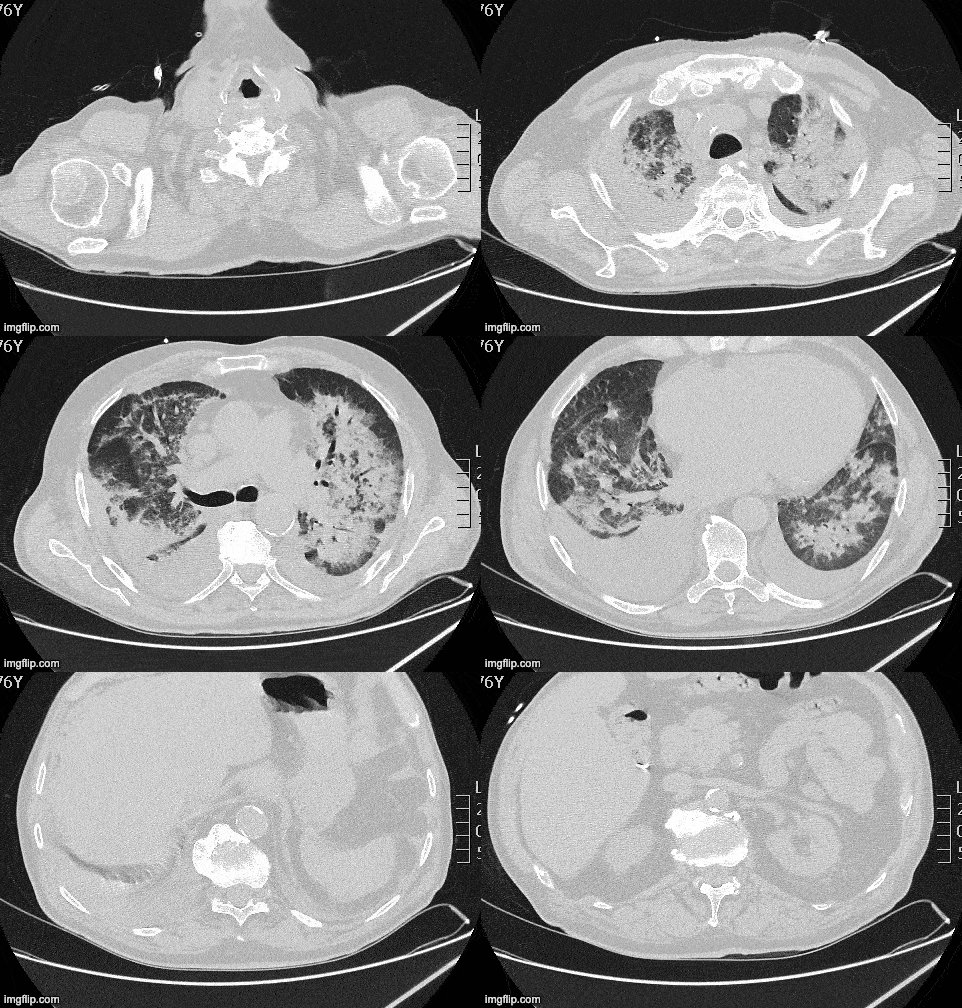
Chest CT Findings in COVID-19
In a study by Ai et al (n=1014), chest CT was compared to RT-PCR for the diagnosis of COVID-19. Characteristic findings on CT included ground-glass opacities, multifocal patchy consolidation, and/or interstitial changes with a peripheral distribution. In patients with a positive RT-PCR, characteristic findings on chest CT demonstrated a sensitivity of 97% and specificity of 25%. In a small subset of patients with serial RT-PCR performed (initial negative followed by positive result) a positive chest CT was present PRIOR to the positive RT-PCR. Link
Image Courtesy of Dr. Marco Garrone (@drmarcogarrone)
The data on lung ultrasound in COVID-19 is limited but continues to evolve. There is already evidence on the use of chest CT in the diagnosis of COVID-19 which is what has driven many providers to turn to ultrasound as an alternative imaging option [3]. Recent studies suggests that lung ultrasound provides similar results compared to chest CT findings in COVID-19 and is superior to standard chest radiography [1]. Advantages of performing lung ultrasound over CT include: ease of use, repeatability, low cost, and avoidance of having to transport a patient with suspected COVID-19 to radiology (potentially exposing health care providers and hospital staff to unnecessary risk). The utility of bedside ultrasound in COVID-19 has not been confirmed by evidence and its role needs to be further delineated in a way that minimizes infectious risks. However, experts have proposed its importance in a variety of patient care scenarios: (1) Rapid assessment of the severity of COVID-19 at presentation (see algorithm by Dr. Mike Stone) (2) Evolution of disease (3) Monitor lung recruitment maneuvers (4) Guide response to prone position (5) Management of extracorporeal membrane therapy (6) Make decisions related to weaning from ventilatory support (7) Differentiation of shock states (including cardiogenic shock) (8) and assessment of fluid tolerance.
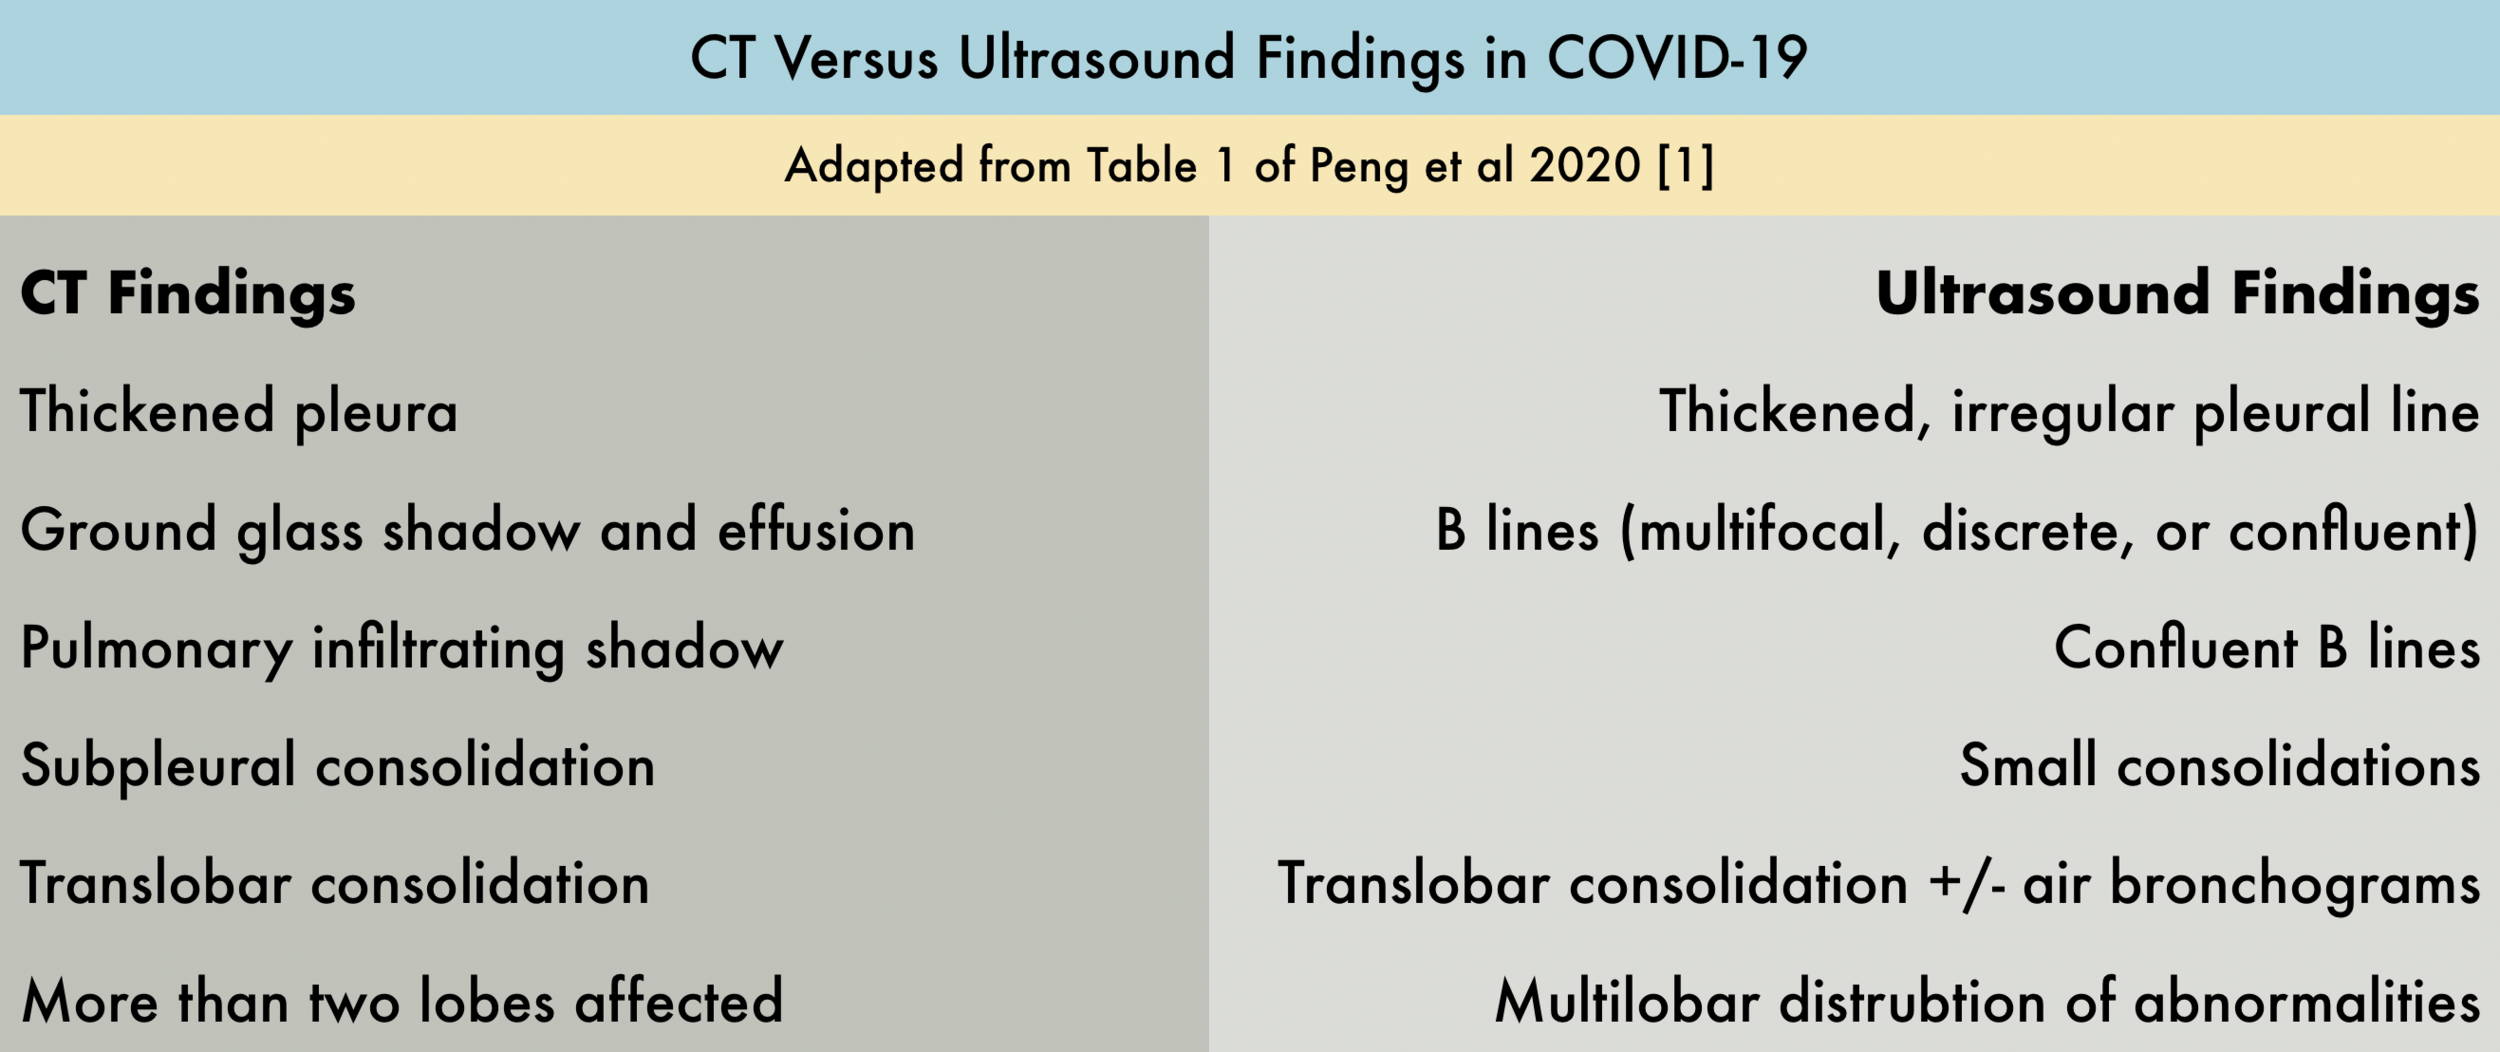
Two recent publications (Peng et al and Huang et al) have characterized important lung ultrasound findings in patients with COVID-19, review of these two publications is highly recommended if you plan on incorporating bedside ultrasound into your clinical management of suspected COVID-19 patients. Characteristic ultrasound findings compared to CT are described in the provided table. Soldati et al have proposed a standardized approach to performing lung ultrasound in patients with suspected COVID-19, including a 14-view (7 views per side) technique, and a scoring system to quantify severity of lung involvement.
A few important points to make:
Large pleural effusions are rare but small effusions can be seen around subpleural consolidations
Lesions are predominately located in the posterior lower fields of both lungs
Compared to B-lines seen in cardiogenic pulmonary edema, the B-lines seen in COVID-19 are patchy with areas of normal lung in between and are associated with an irregular pleural line with punctate defects.
The degree of lung findings appears to correlate with severity of lung injury:
Mild - Focal scattered B-lines
Progressive/Severe - Interstitial syndrome (diffuse B-lines) + lung consolidation
COVID Beyond the Lungs: Reports out of cities seeing large volumes of COVID-19 patients have reported high rates of cardiac complications including cardiogenic shock, myocarditis, and arrhythmias (Wang). It may be beneficial to approach critically ill patients with suspected or known COVID-19 as having undifferentiated shock, assessing their fluid tolerance, and evaluating for acute decompensated heart failure early in their course. There may also be a role for POCUS for confirming central lines, intubations, and ruling out a pneumothorax after invasive procedures. This may further decrease x-ray utilization and prevent contamination, staff exposure, and utilization of PPE.
Timeline of COVID-19 Lung Ultrasound Findings: A Case Study
Dr. Yale Tung Chen is an Emergency Medicine physician currently living with an active COVID-19 infection. He currently serves as the Director of the Ultrasound Division at Hospital Universitario La Paz in Madrid, Spain. He has graciously allowed us to share his #mycoviddiary on our site to help educate and provide a perspective on symptoms in comparison to lung ultrasound findings. Follow him on Twitter @yaletung!
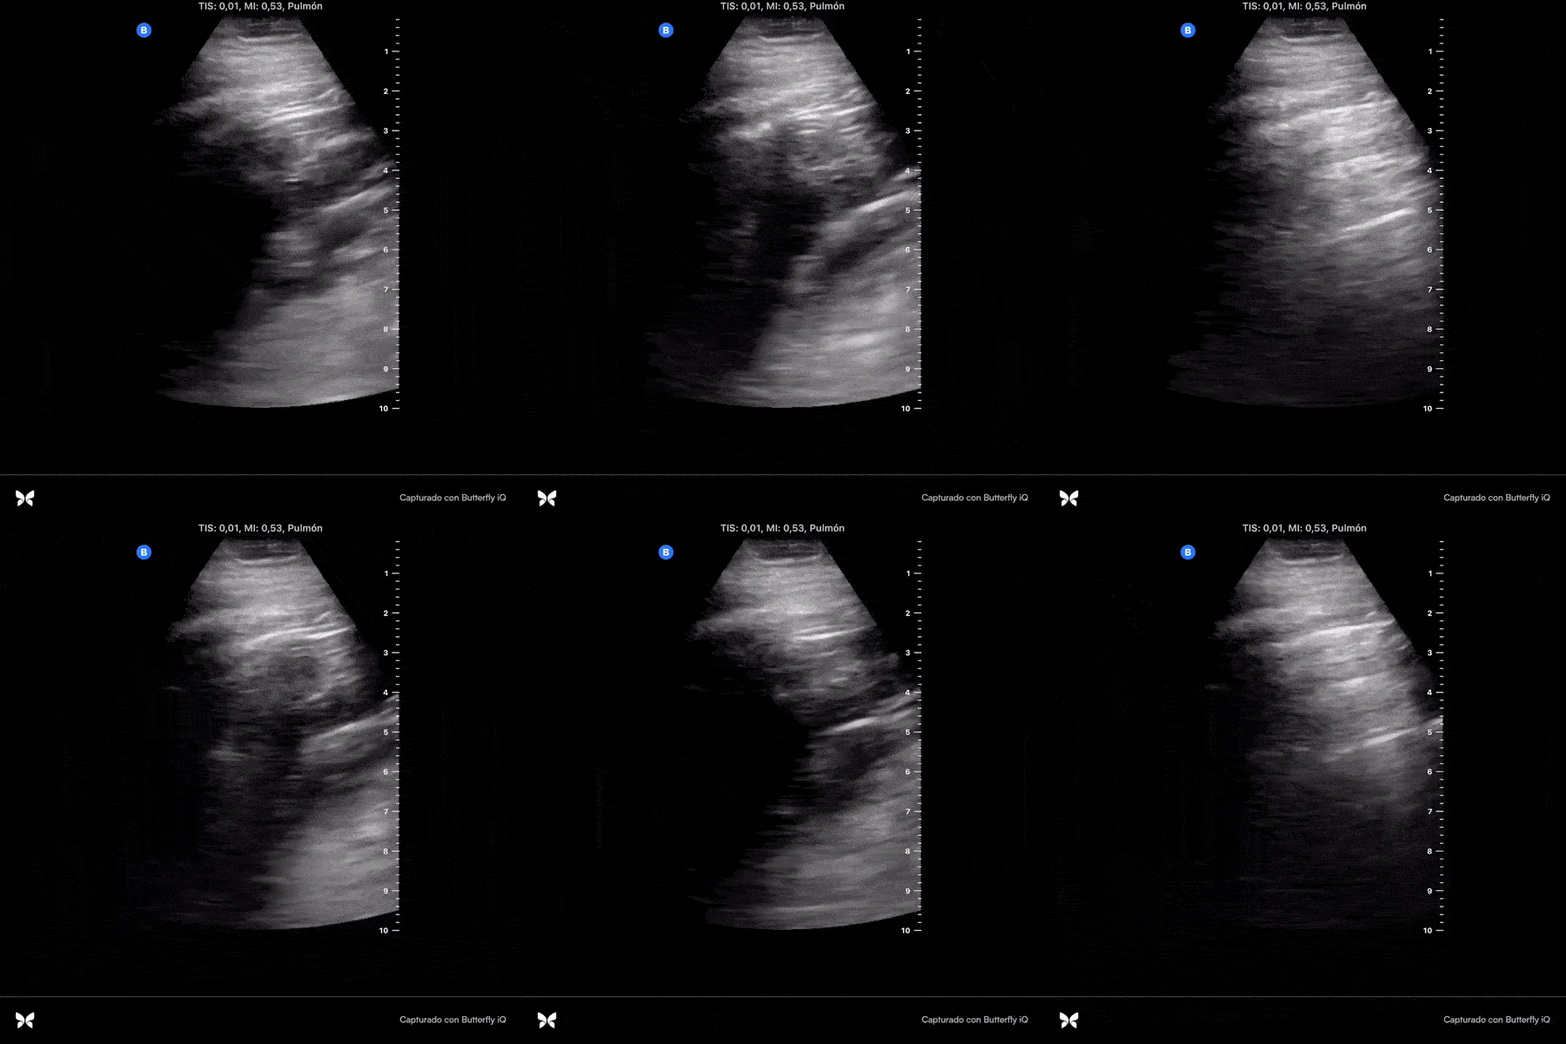
Day 1 after #COVID diagnosis. Sore throat, headache (strong!), dry cough but not shortness of breath. No lung US abnormalities. Will keep a #POCUS track of my lungs.
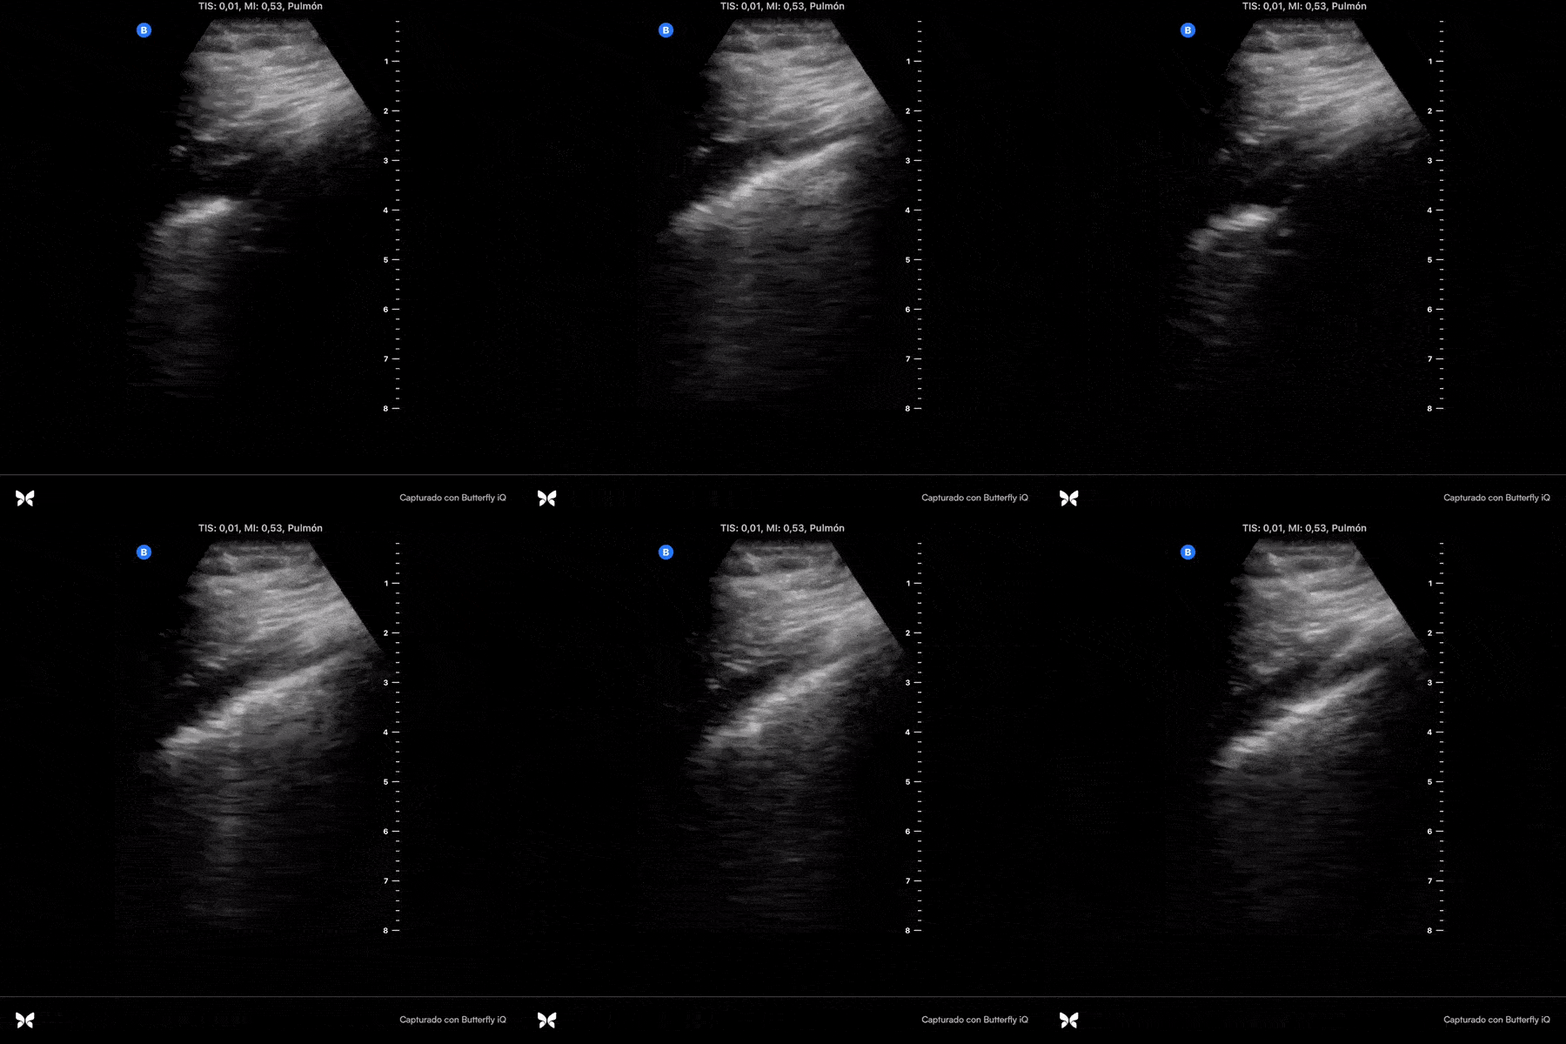
Day 2 after #COVID diagnosis. Less sore throat, cough & headache (thank God!), still no shortness of breath or pleuritic chest pain. #POCUS update: small bilateral pleural effusion, thickened pleural line & basal b-lines (plaps).
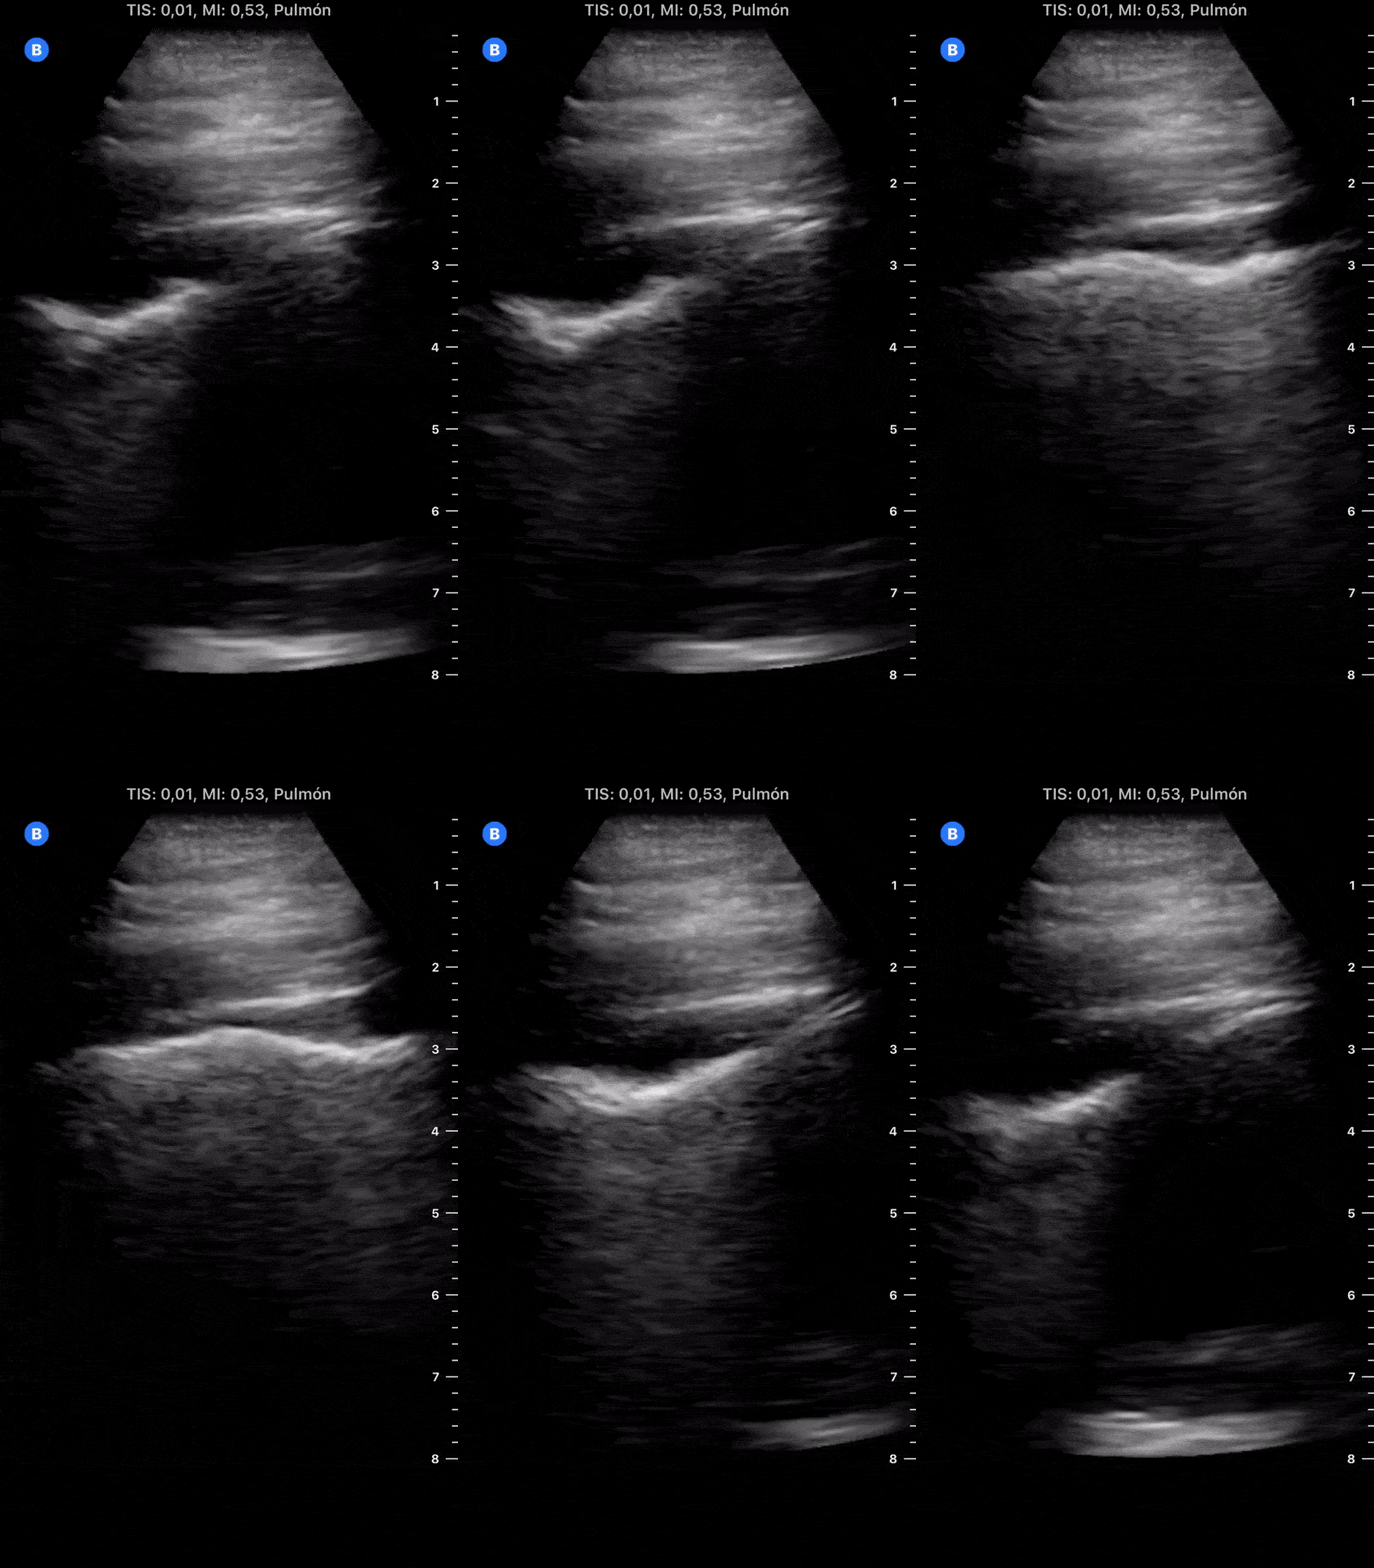
Day 3 after #COVID diagnosis. No sore throat/headache. Yesterday was cough day, still no shortness of breath/chest pain. Diarrhea started, lucky cough got better. #POCUS update: similar effusion, seems less thickened pleural line + no b-lines (PLAPS).
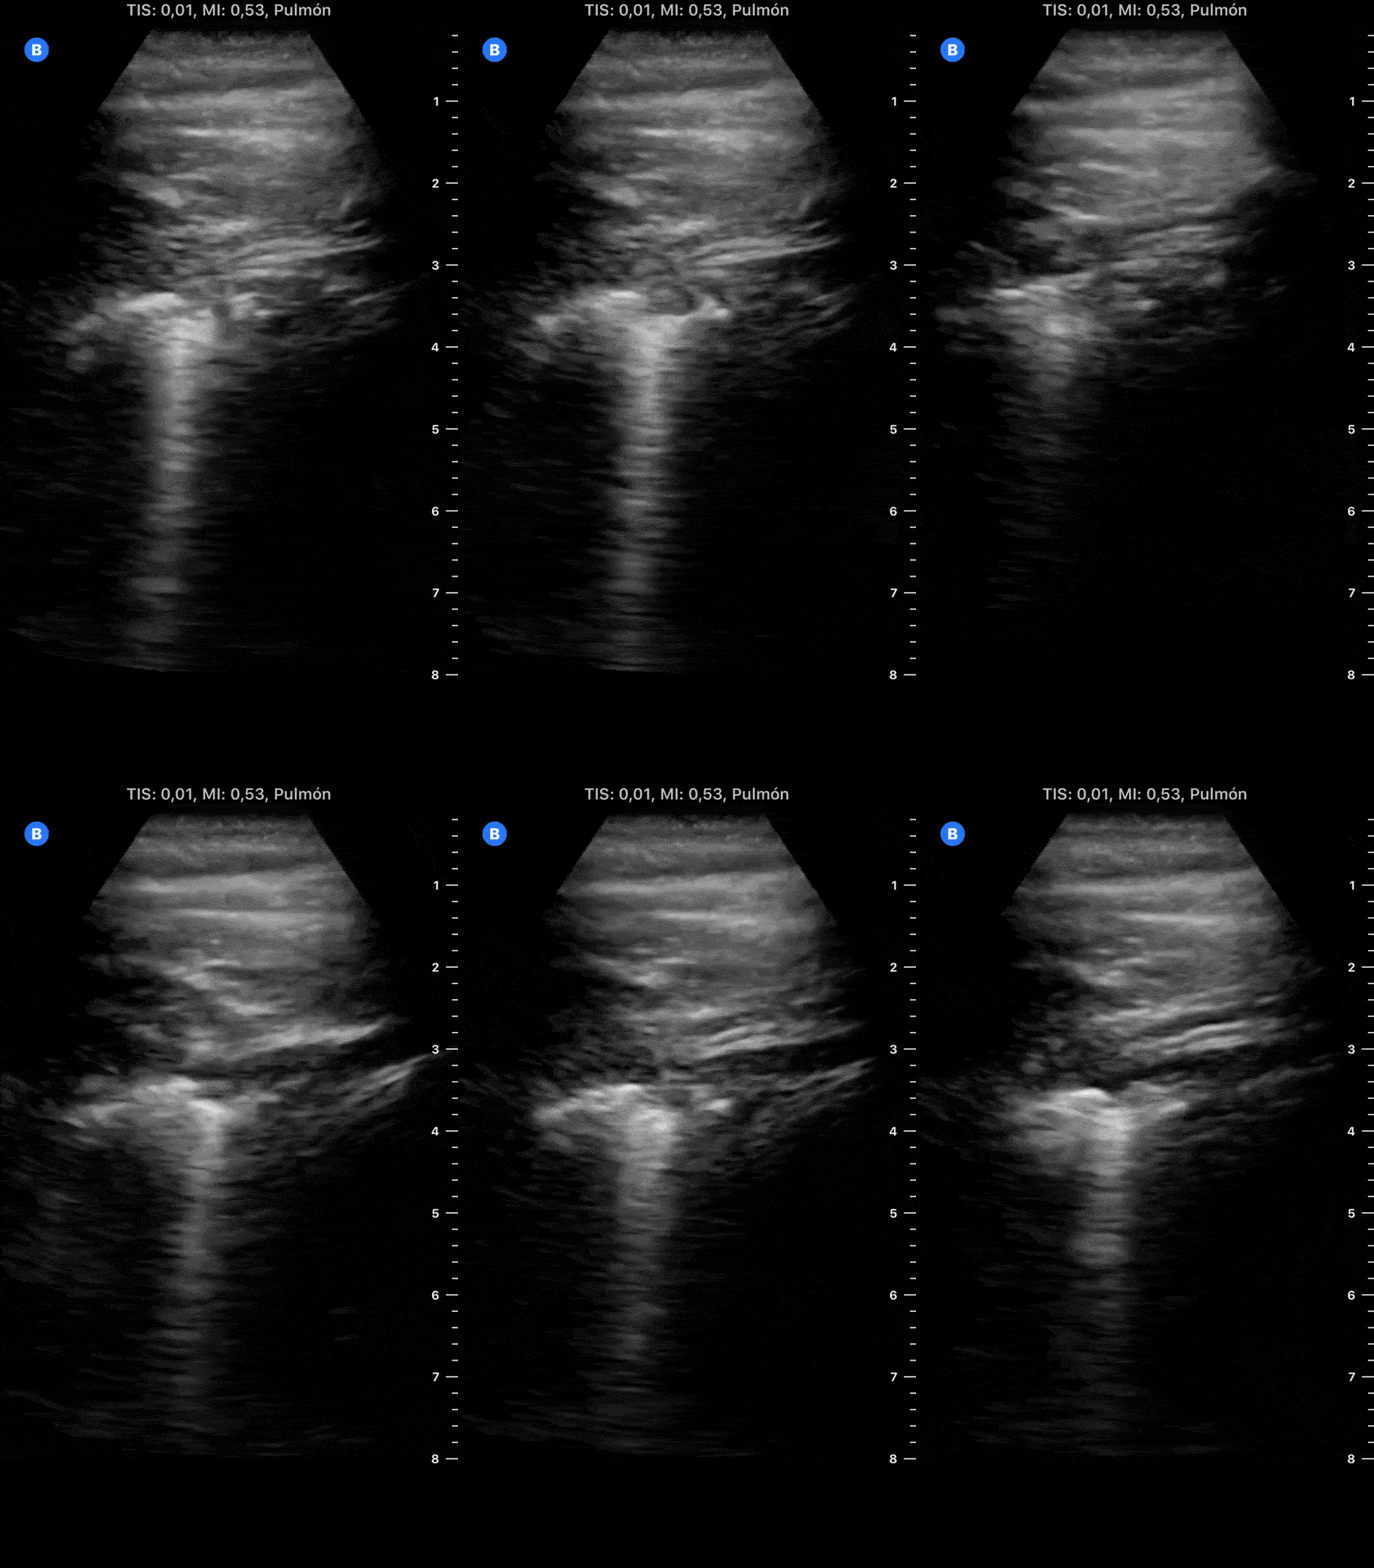
Day 4 after #COVID diagnosis. More cough & tiredness (very badly), still no dyspnea/chest pain. #POCUS update: Right side on resolution, Left side a more thickened pleural line + 2 subpleural consolidations.
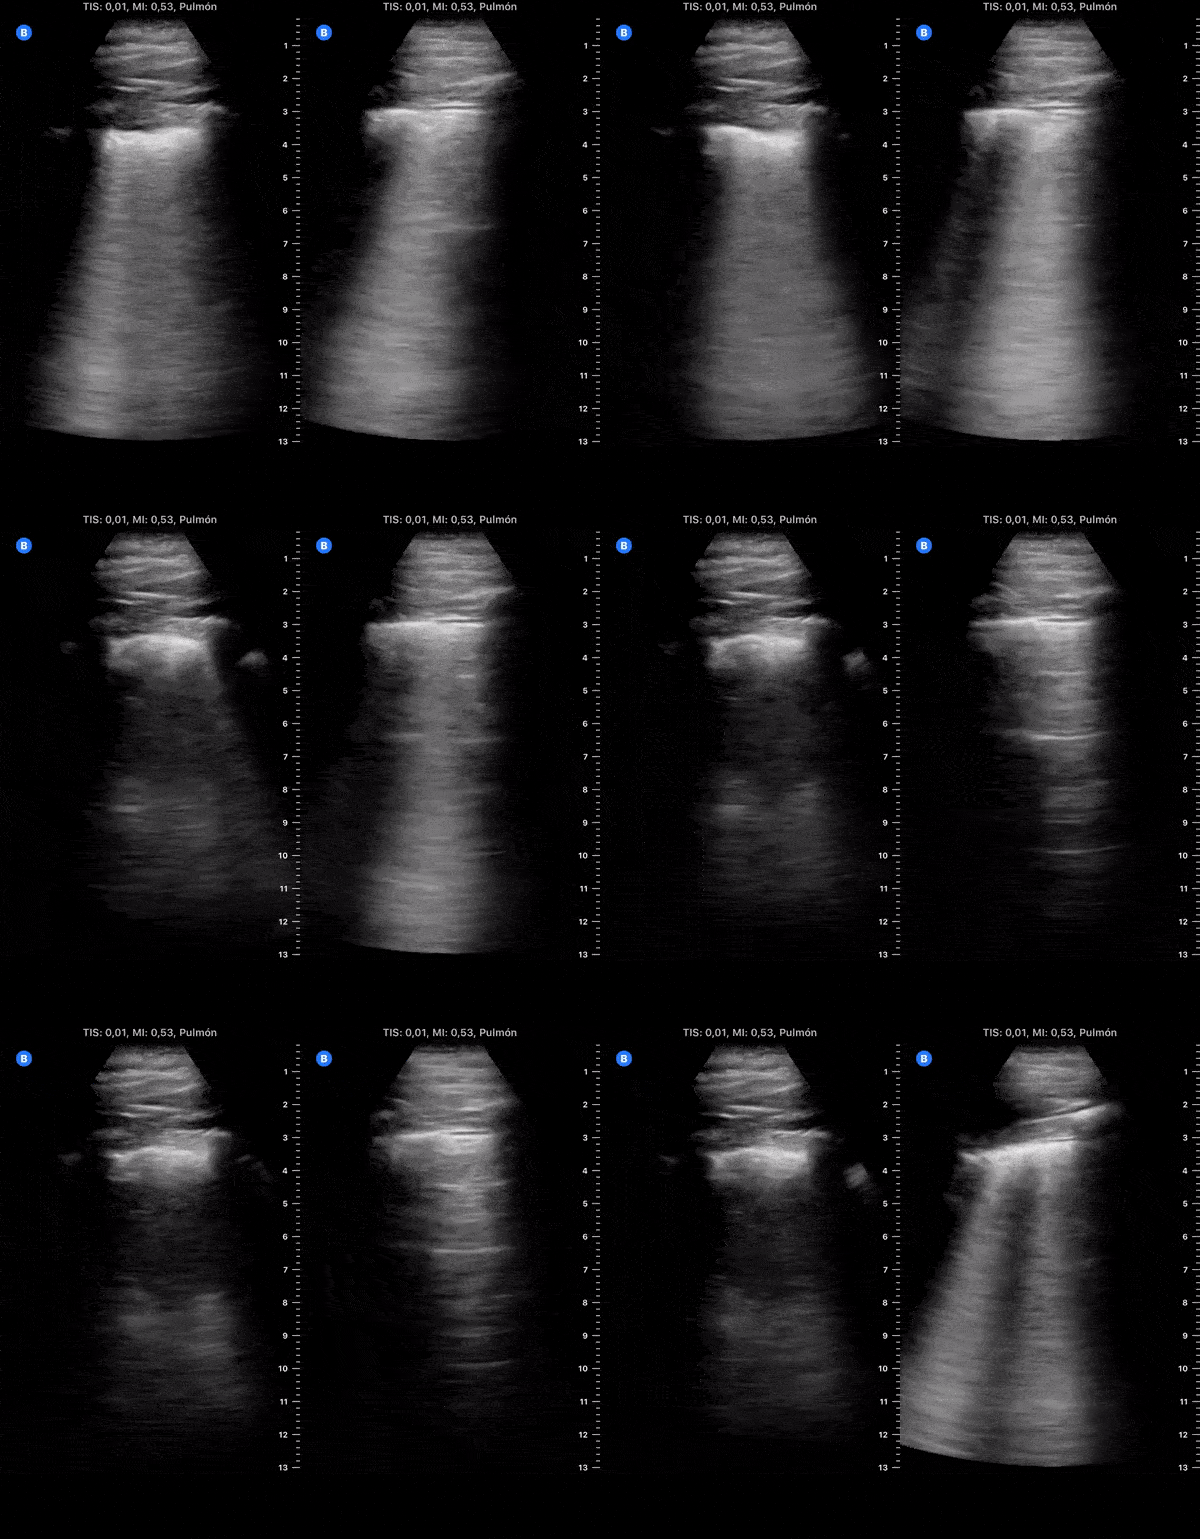
Day 5 after #COVID diagnosis. Less cough & tired, still no dyspnea/chest pain. #POCUS update: Effusion resolved, as subpleural consolidations spread bilaterally on both posterior lower lobes.
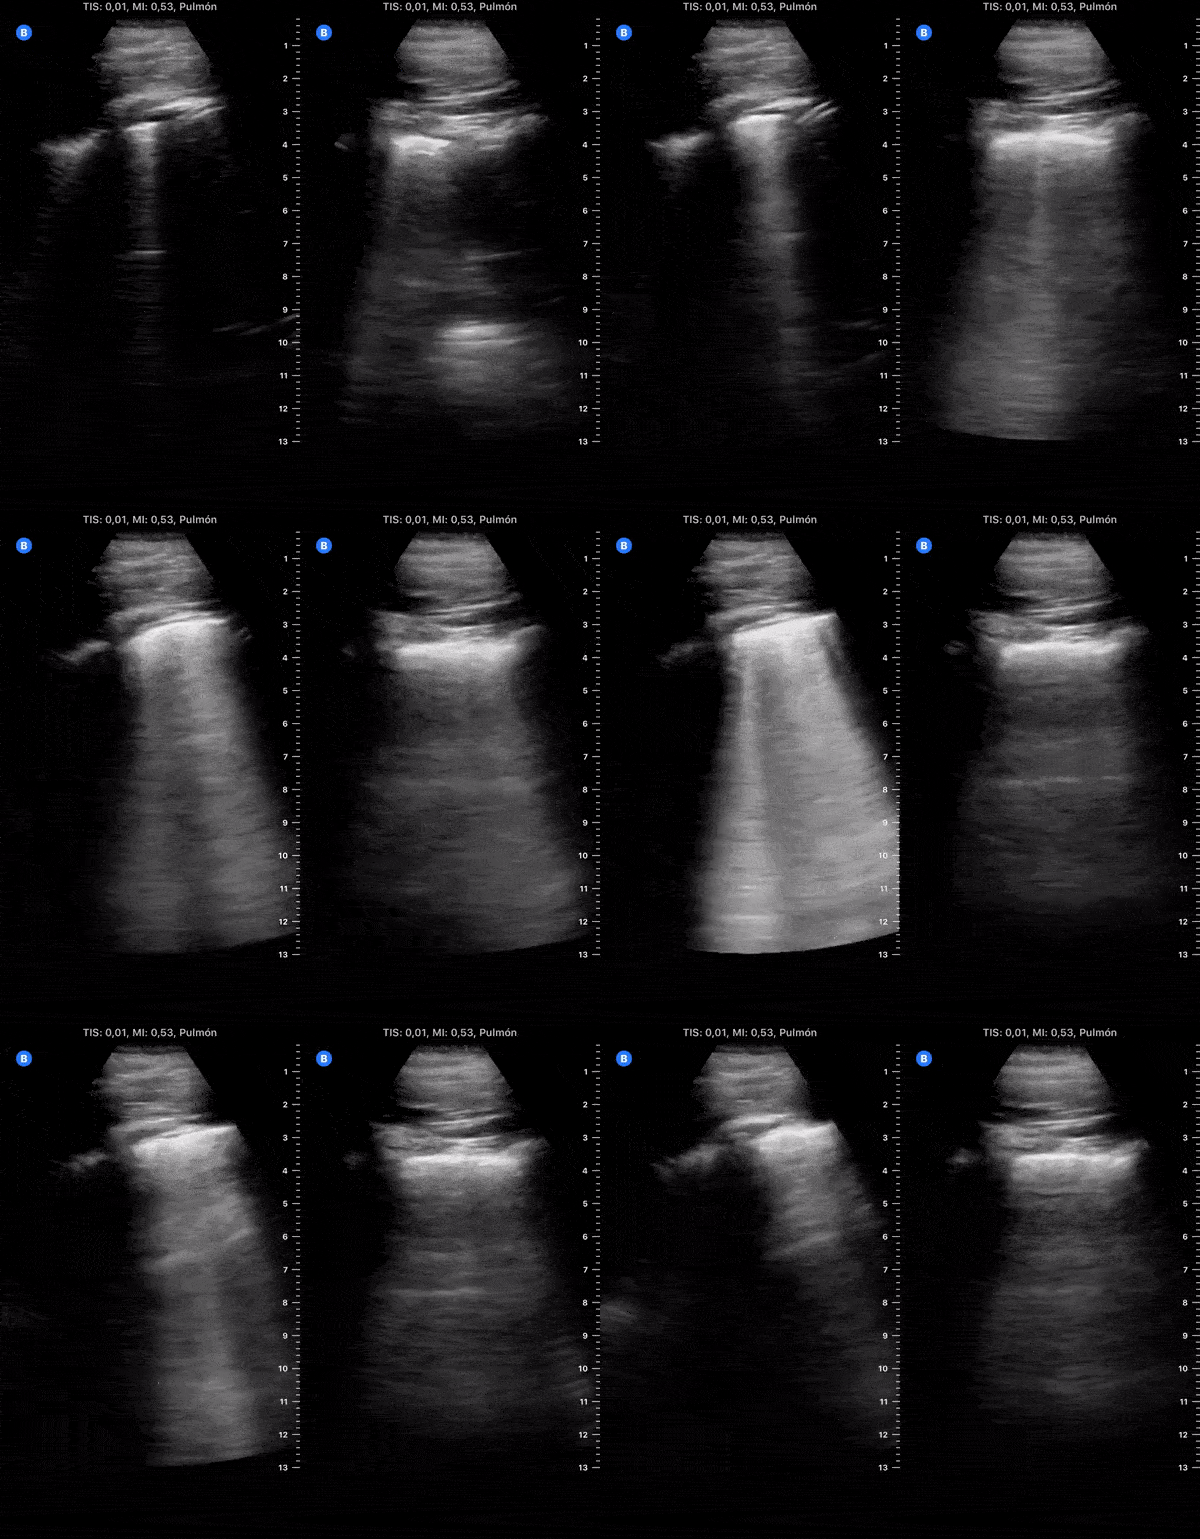
Day 6 after #COVID diagnosis. Less cough, bit tired, still no dyspnea. No fever. Oxygen saturation 98%. #POCUS update: thick pleural line, b-lines and subpleural consolidations tend to resolve. Significant lung improve from yesterday.
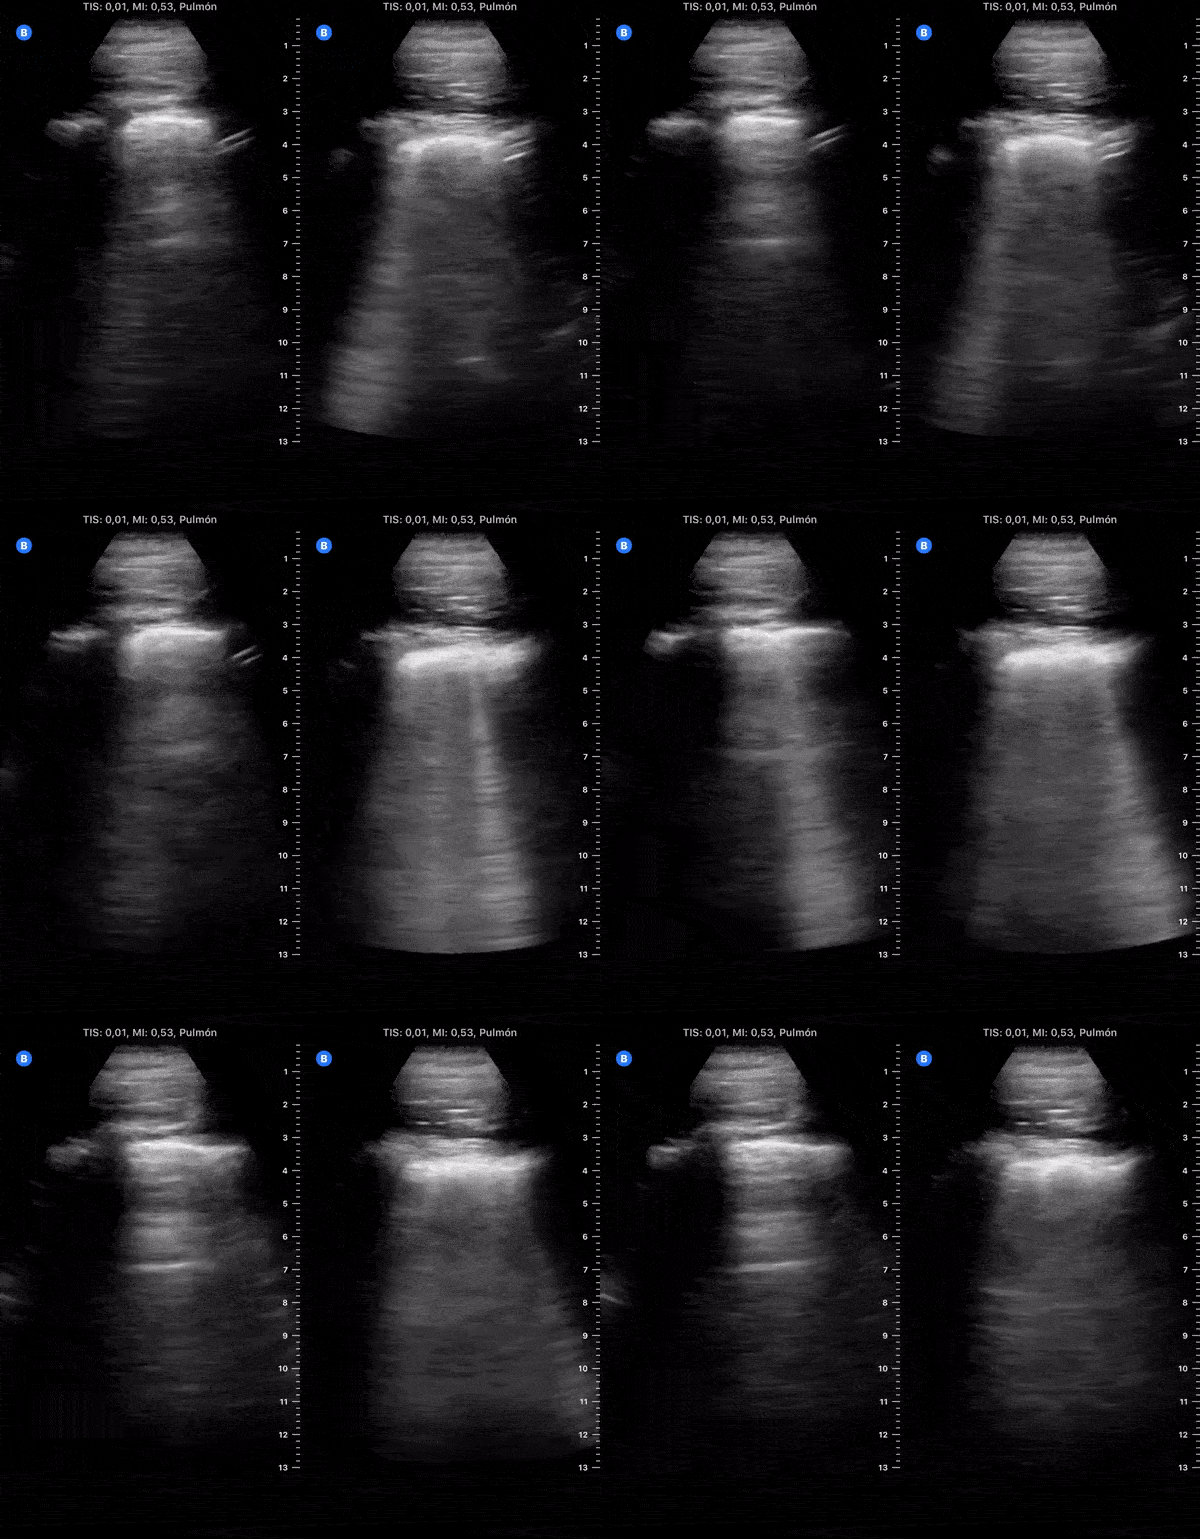
Day 7 after #COVID diagnosis. Cough & weakness got worse (again), still no dyspnea. No fever. SpO2 96%. #POCUS update: similar to yesterday - thick pleural line, b-lines & consolidations tend to resolve.
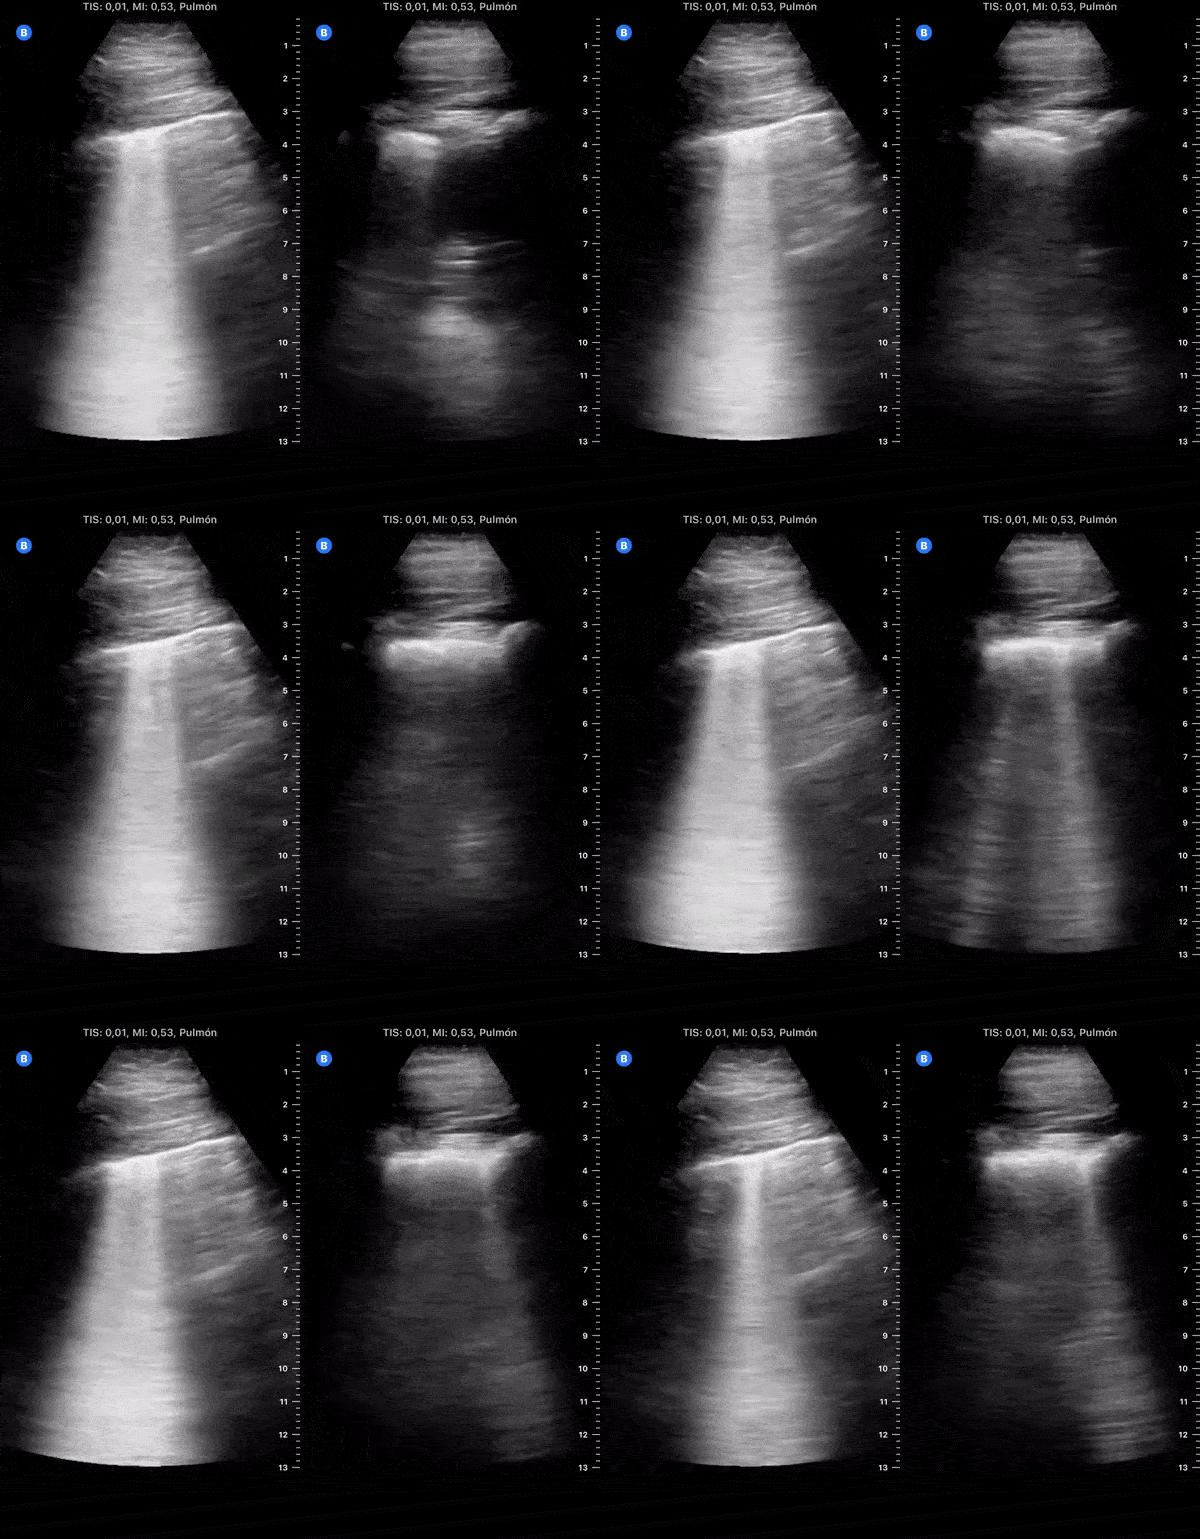
Day 8 after #COVID diagnosis. Less Cough & similar weakness, still no dyspnea or red flag symptoms. No fever. SpO2 96%. #POCUS update: Right resolved. Left lower lobe much better. Left lateral appeared new focal B-lines.
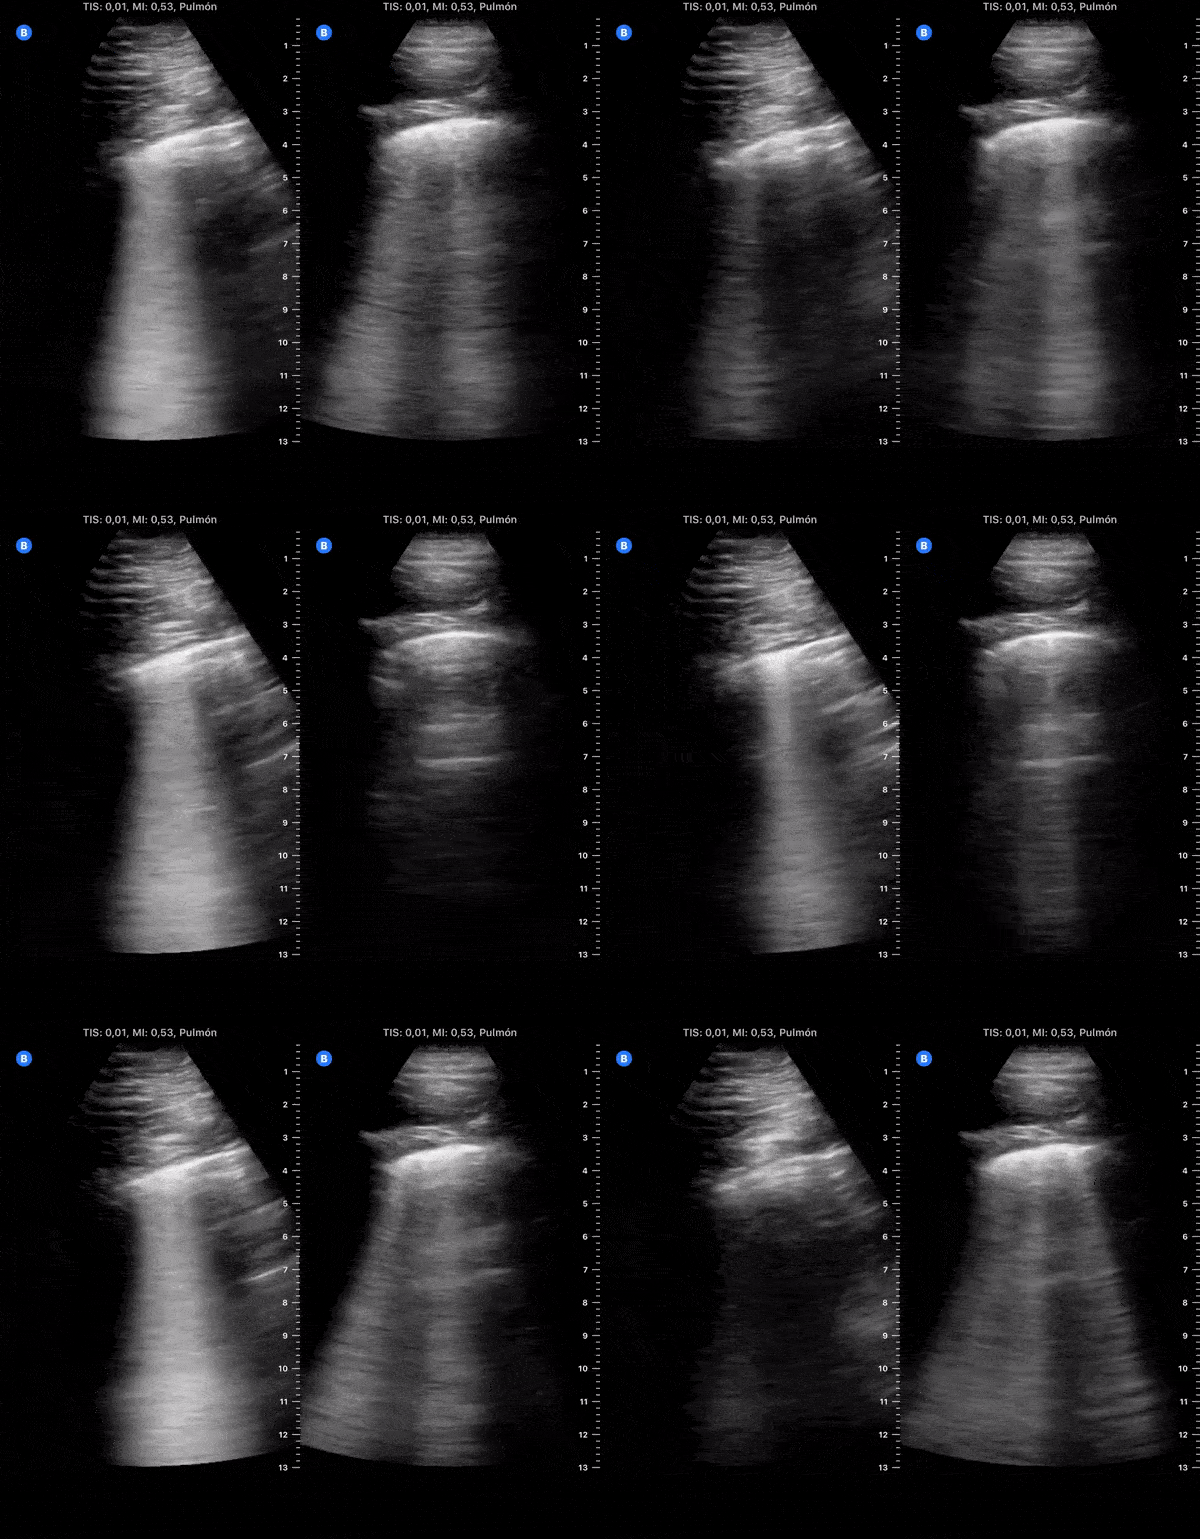
Day 9 after #COVID diagnosis. Feeling slightly better. More cough. No dyspnea or red flag symptoms. No fever. SpO2 97%. #POCUS update: similar to yesterday. Left lower & lateral with thick pleural line & focal B-lines.
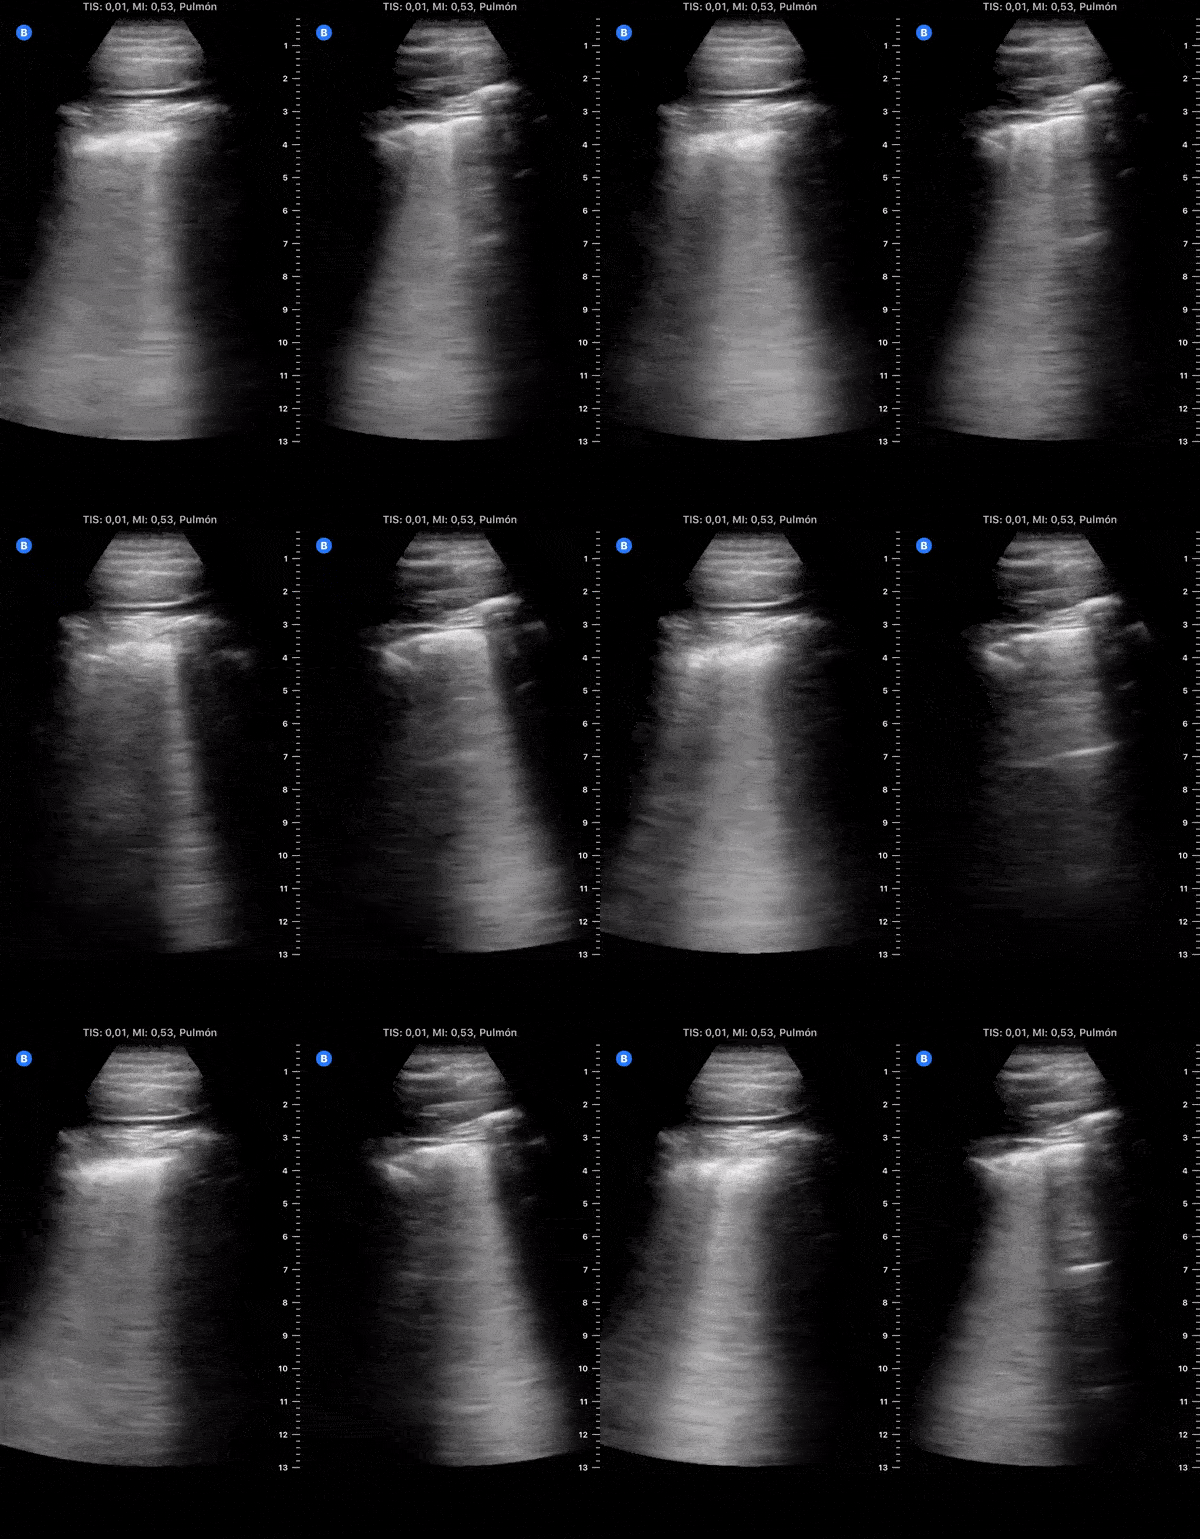
Day 10 after #COVID diagnosis. Less tired, but more cough, ageusia & anosmia. No dyspnea or red flag symptoms. No fever. SpO2 97%. #POCUS update: Right, Left lower & lateral with thick pleural line & focal B-lines.
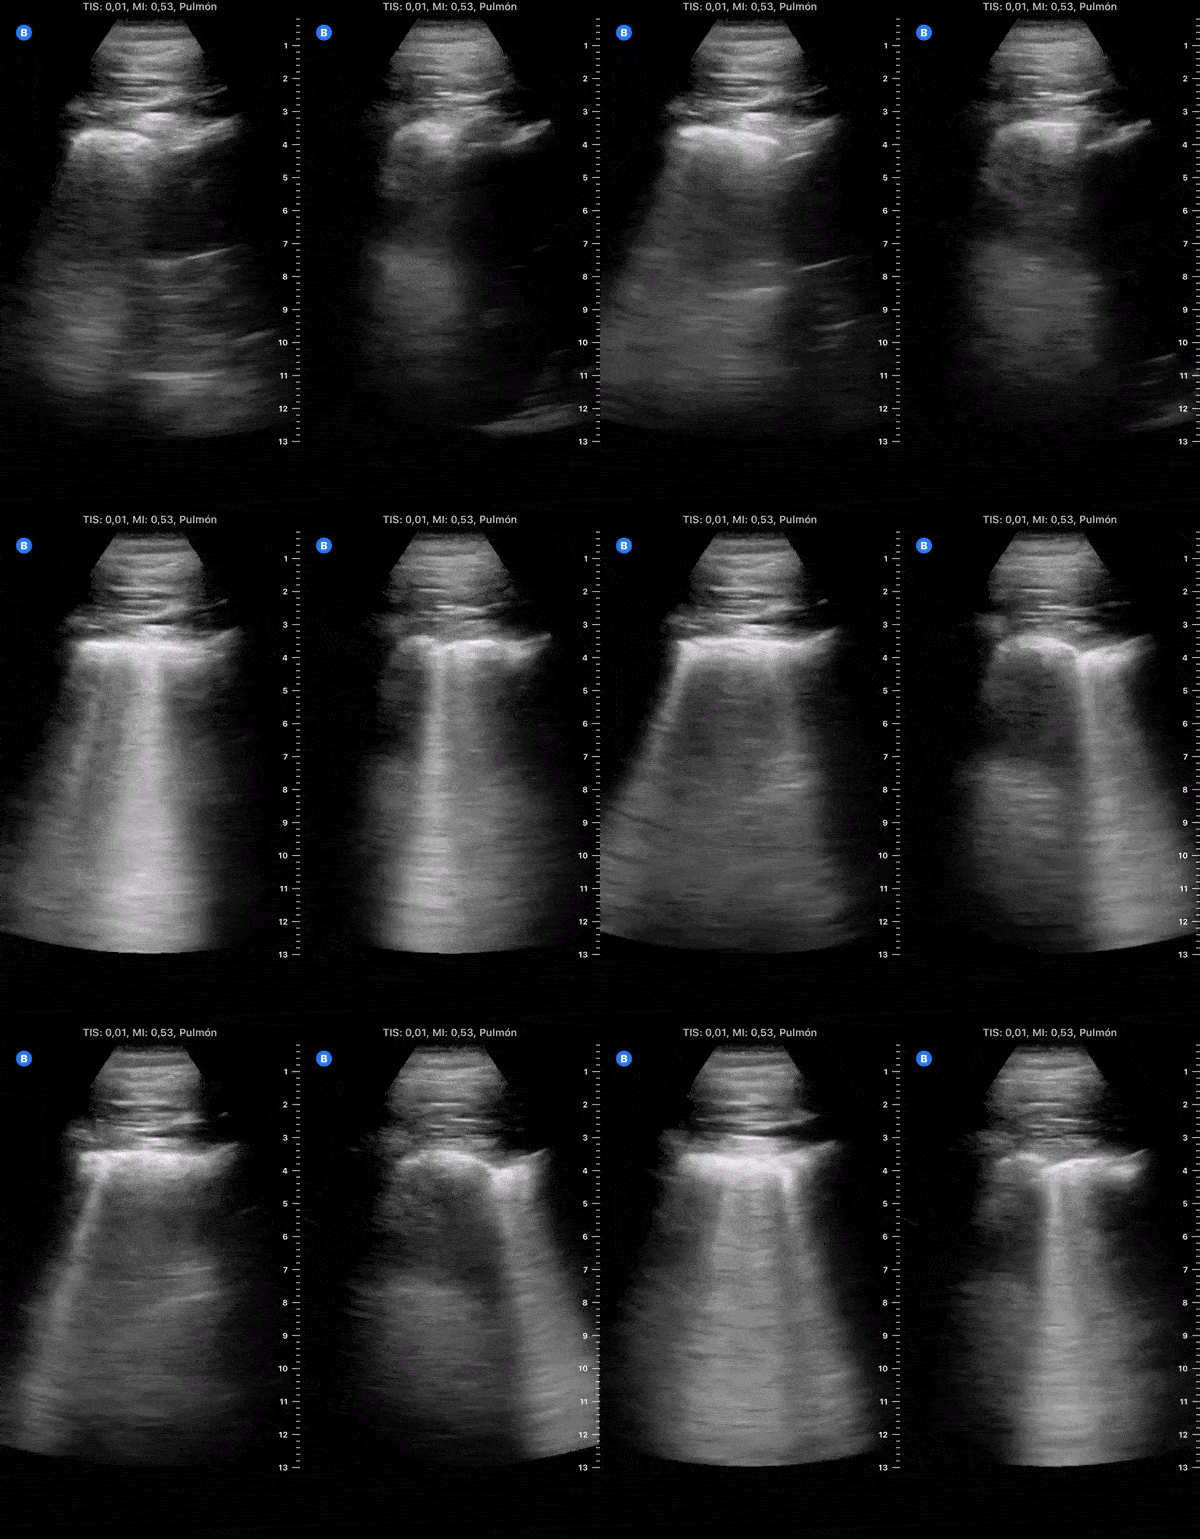
Day 11 after #COVID diagnosis. Less tired & cough, unable to endure small efforts. No dyspnea or red flag symptoms. No fever. SpO2 98%. #POCUS update: Bilateral subpleural consolidations, thick pleura & focal B-lines.
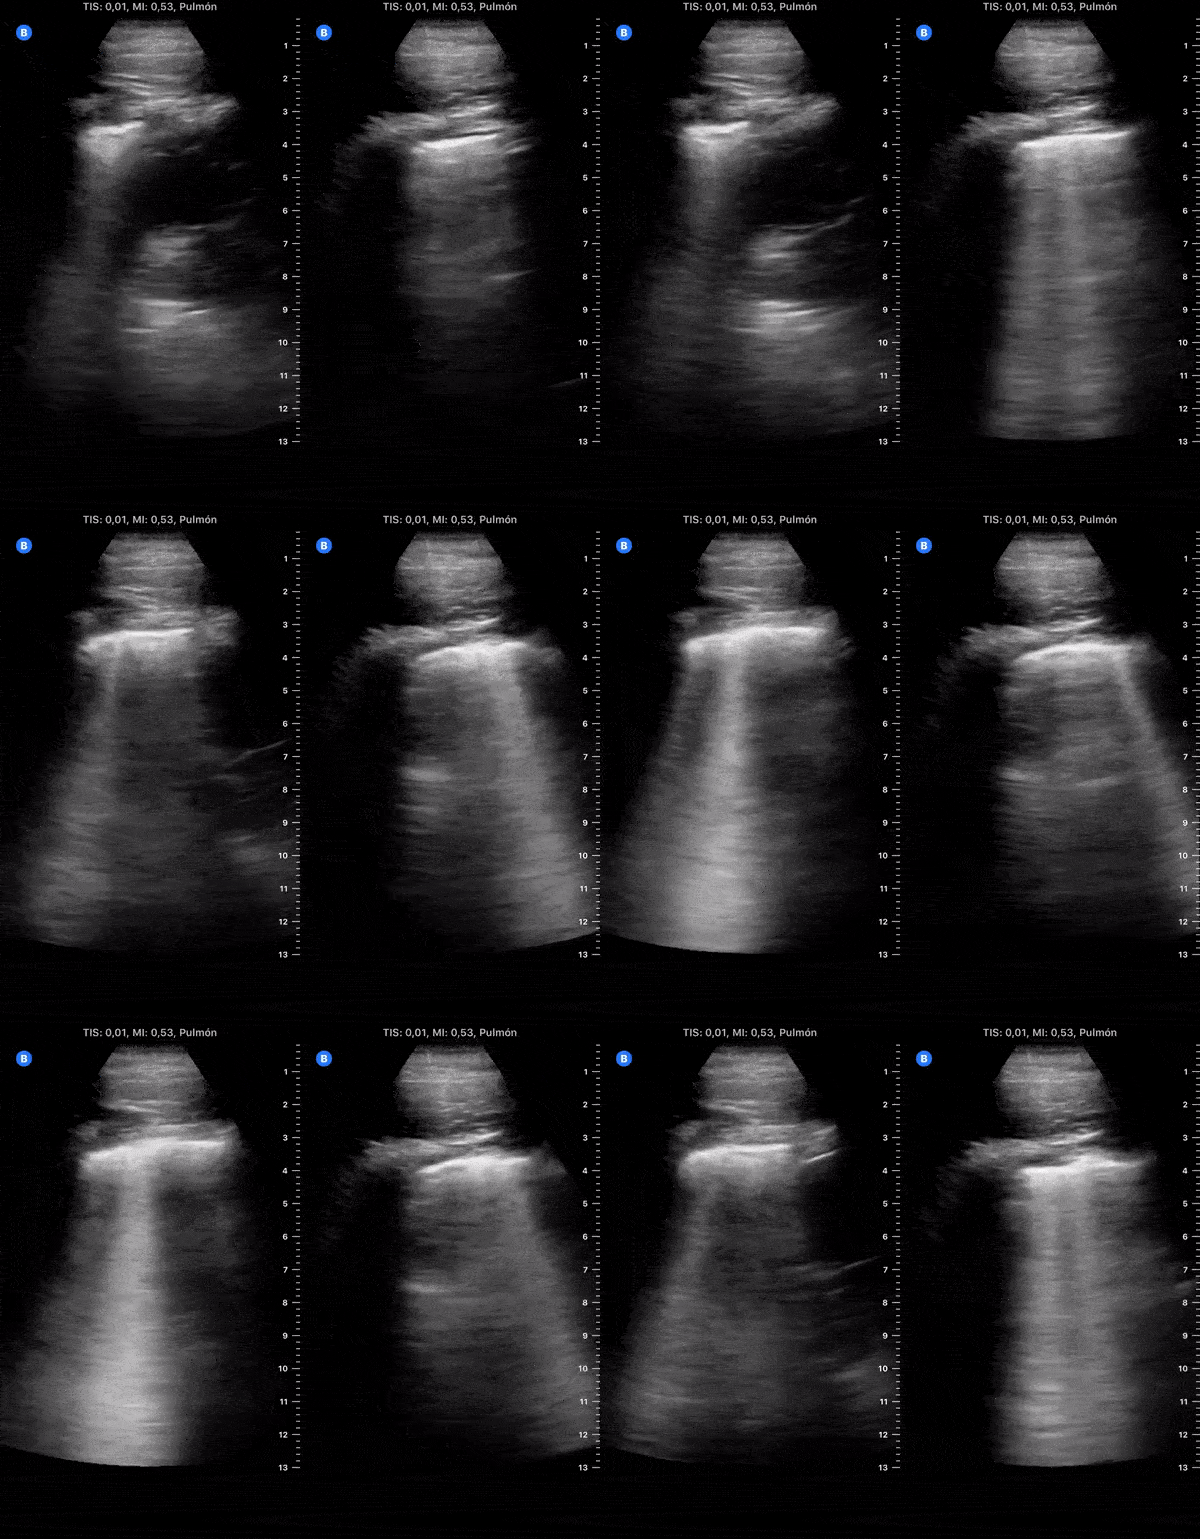
Day 12 after #COVID diagnosis. Better, main symptoms cough, nausea & diarrhea. No dyspnea or red flag symptoms. No fever. SpO2 98%. #POCUS update: Subpleural consolidations resolving, thick pleura & B-lines, small effusion.
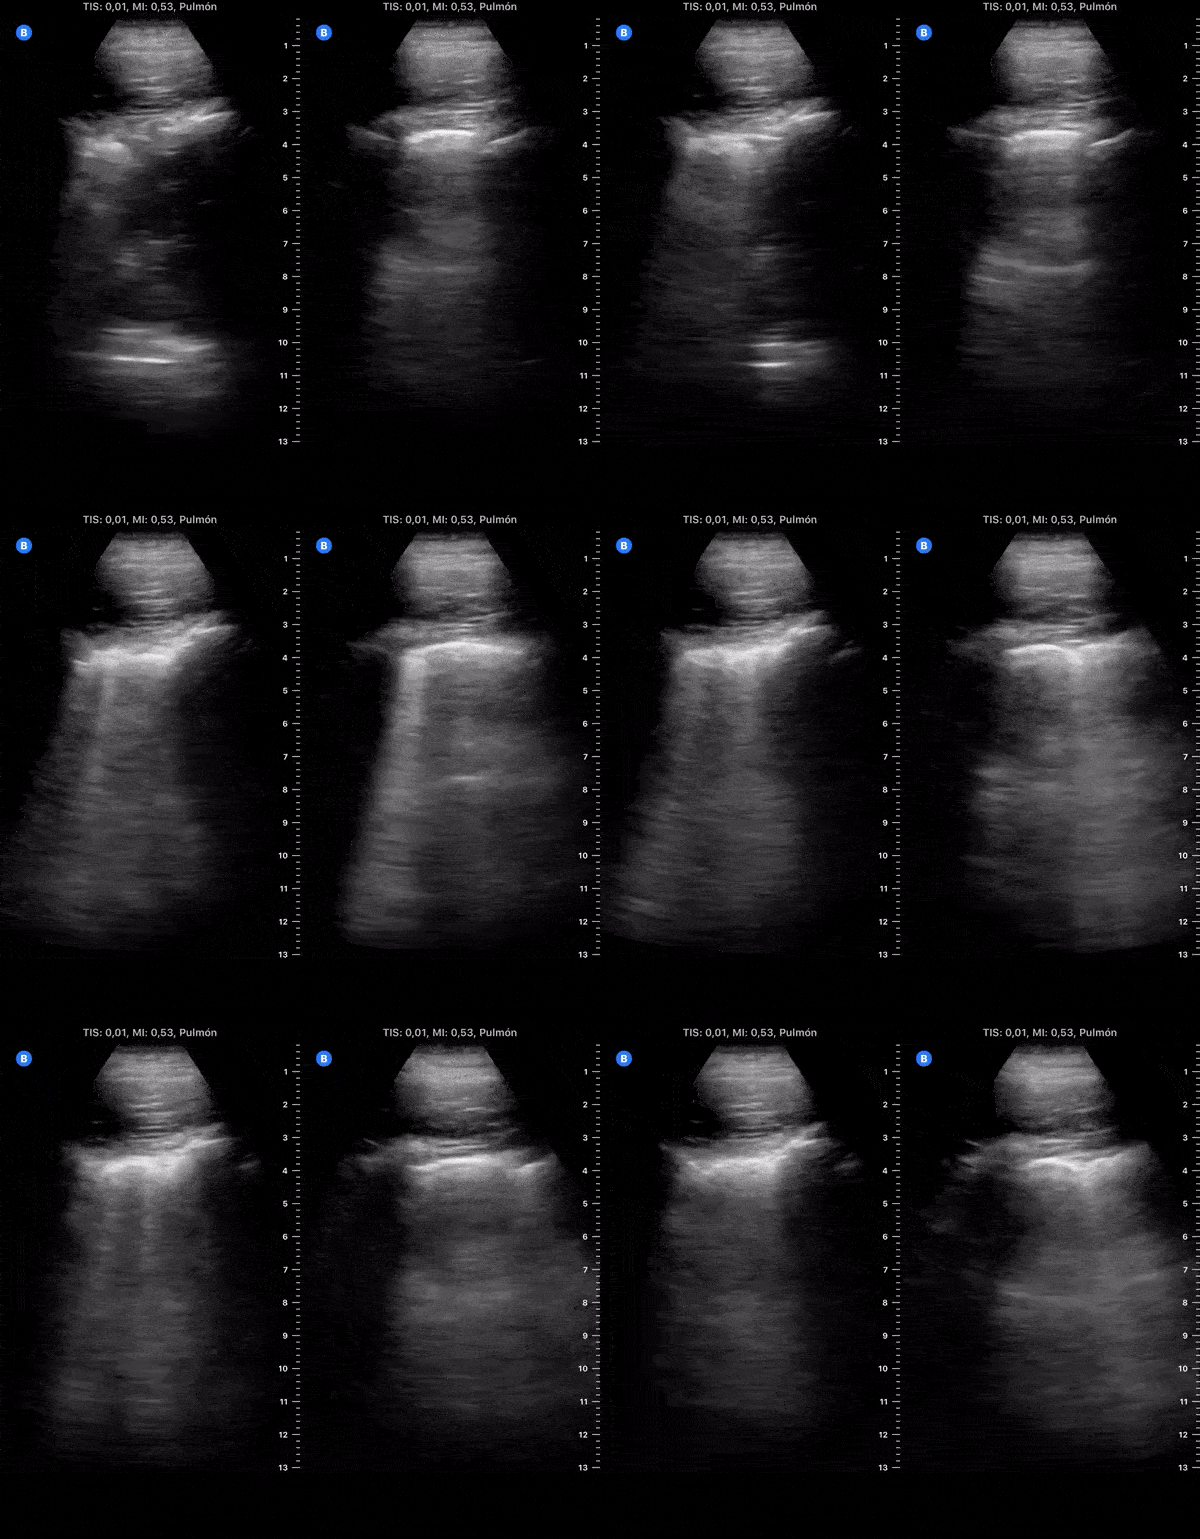
Day 13 after #COVID diagnosis. Lesser cough, weakness, nausea & diarrhea. No dyspnea or red flag symptoms. No fever. SpO2 97%. #POCUS update: 2 subpleural consolidations (resolving), thick pleura & bilateral scattered B-lines.
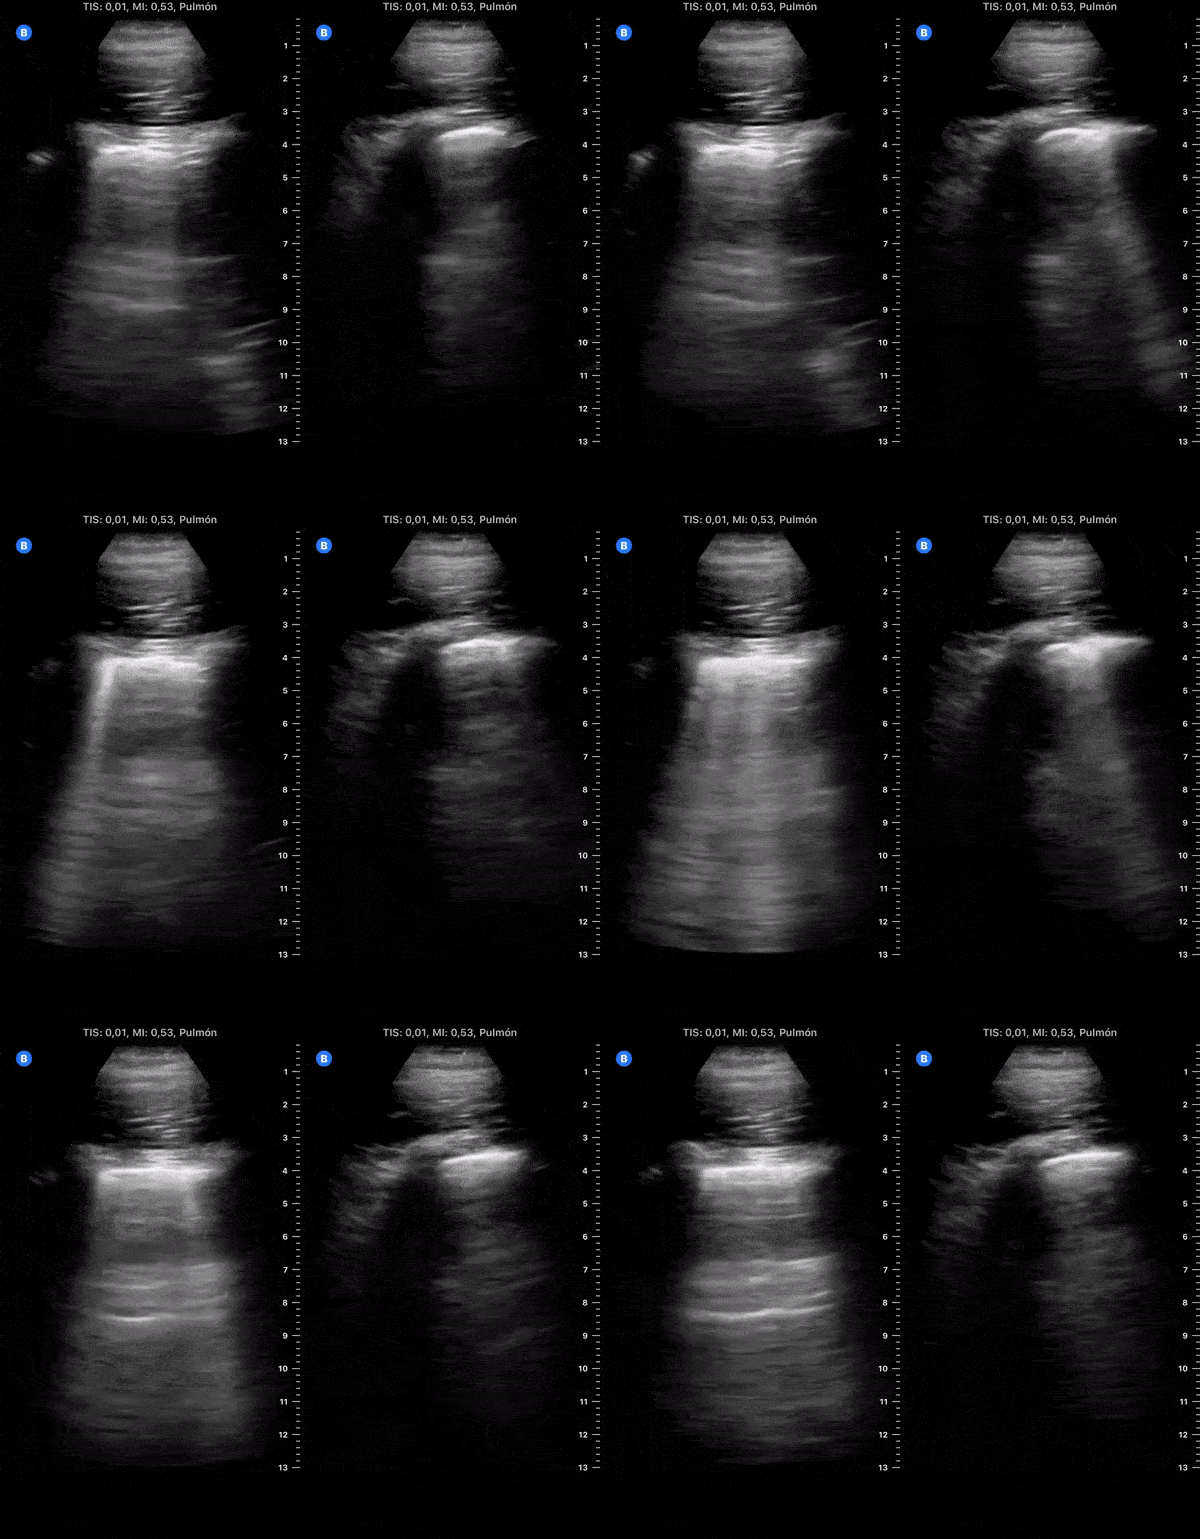
Day 14 after #COVID diagnosis. Less symptoms - cough, weakness, nausea, light headache. Regaining appetite/smell. No fever/dyspnea. SpO2 98%. #POCUS update: Improving - thick pleura & Bilateral scattered B-lines, no effusion.
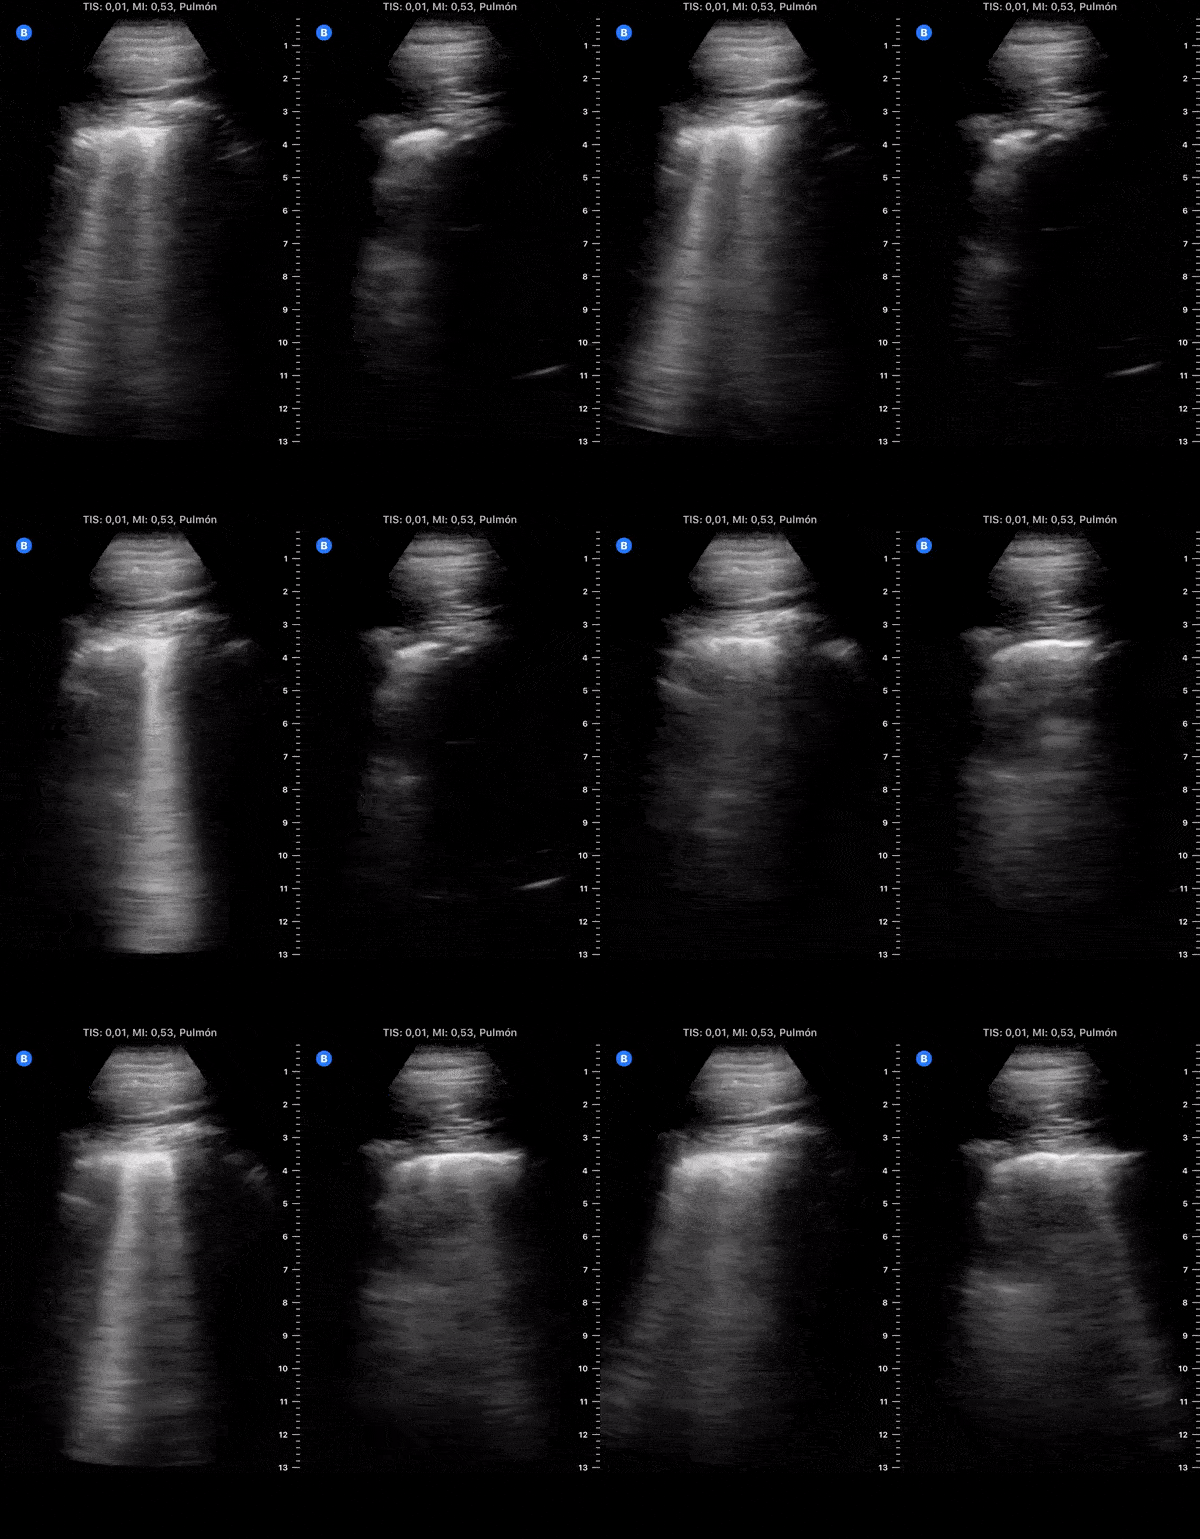
Day 15 after #COVID diagnosis. Similar cough, less weakness. Diarrhea due azithromycin. No fever or shortness of breath. SpO2 97%. #POCUS update: Similar to yesterday, thick pleura & bilateral scattered B-lines.
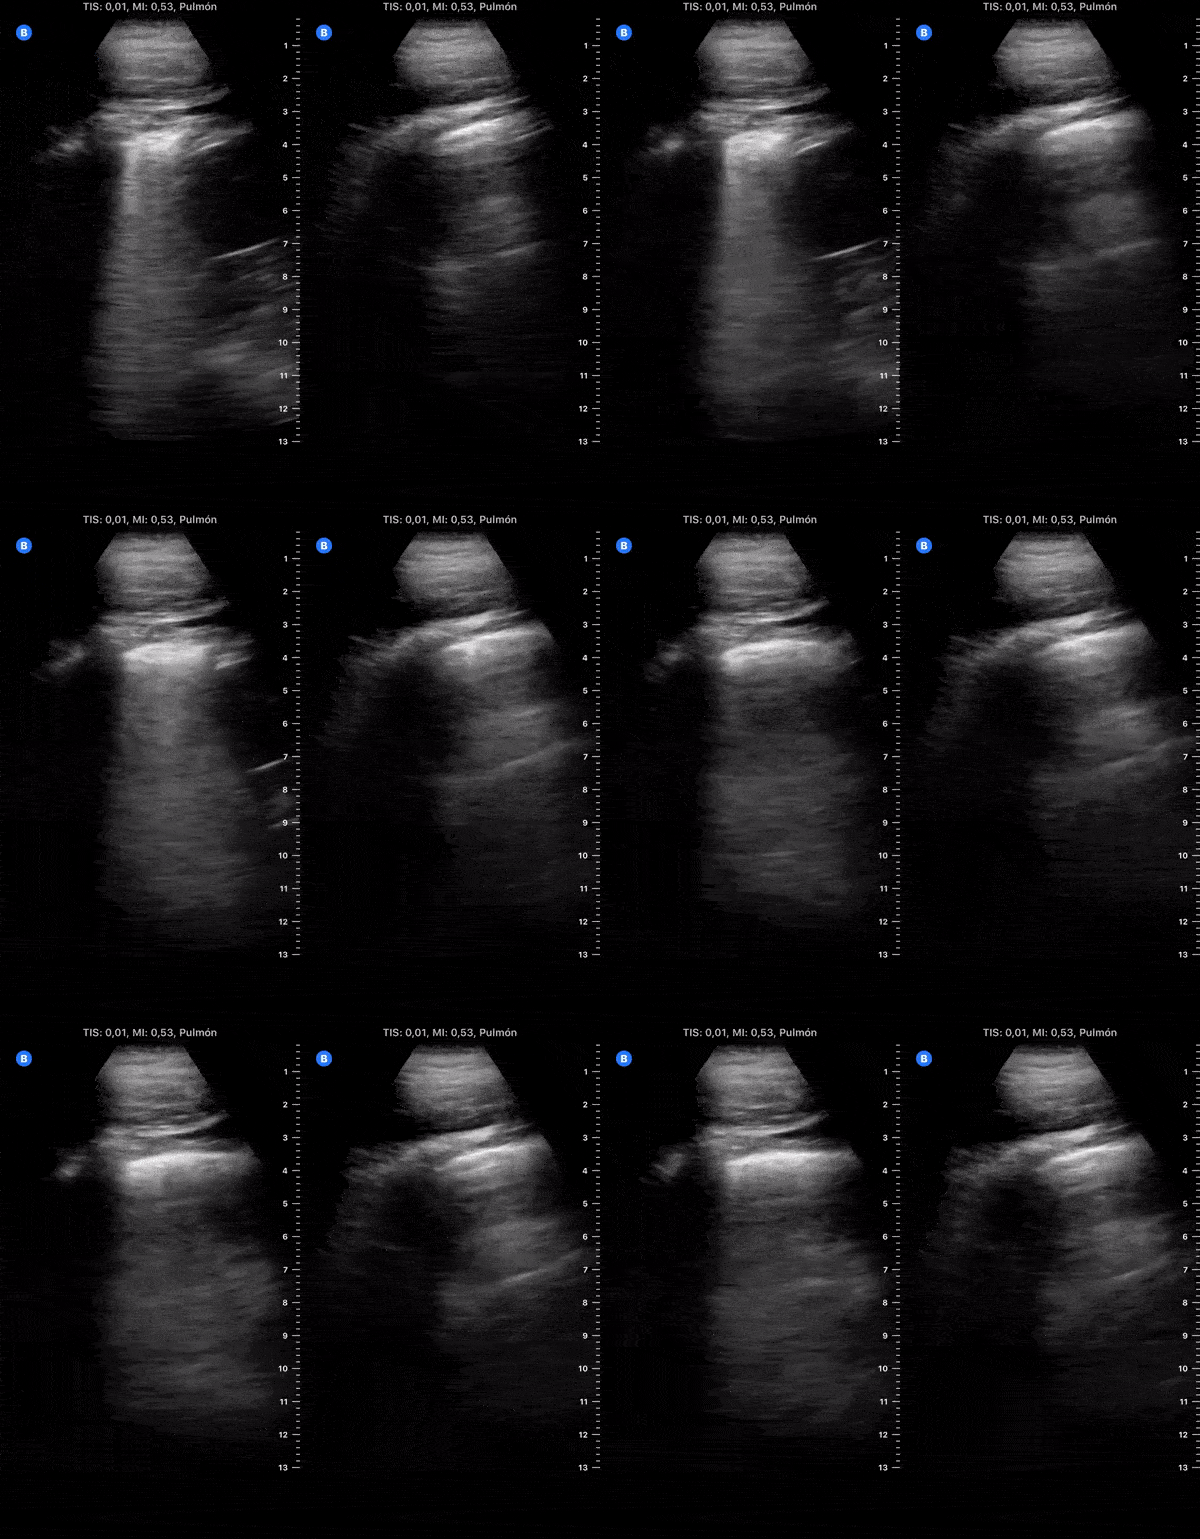
Day 16 after #COVID diagnosis. Similar dry cough, but with good energy & high spirit. No fever or dyspnea. SpO2 97%. #POCUS update: Improved, less thickened pleura & less bilateral B-lines.
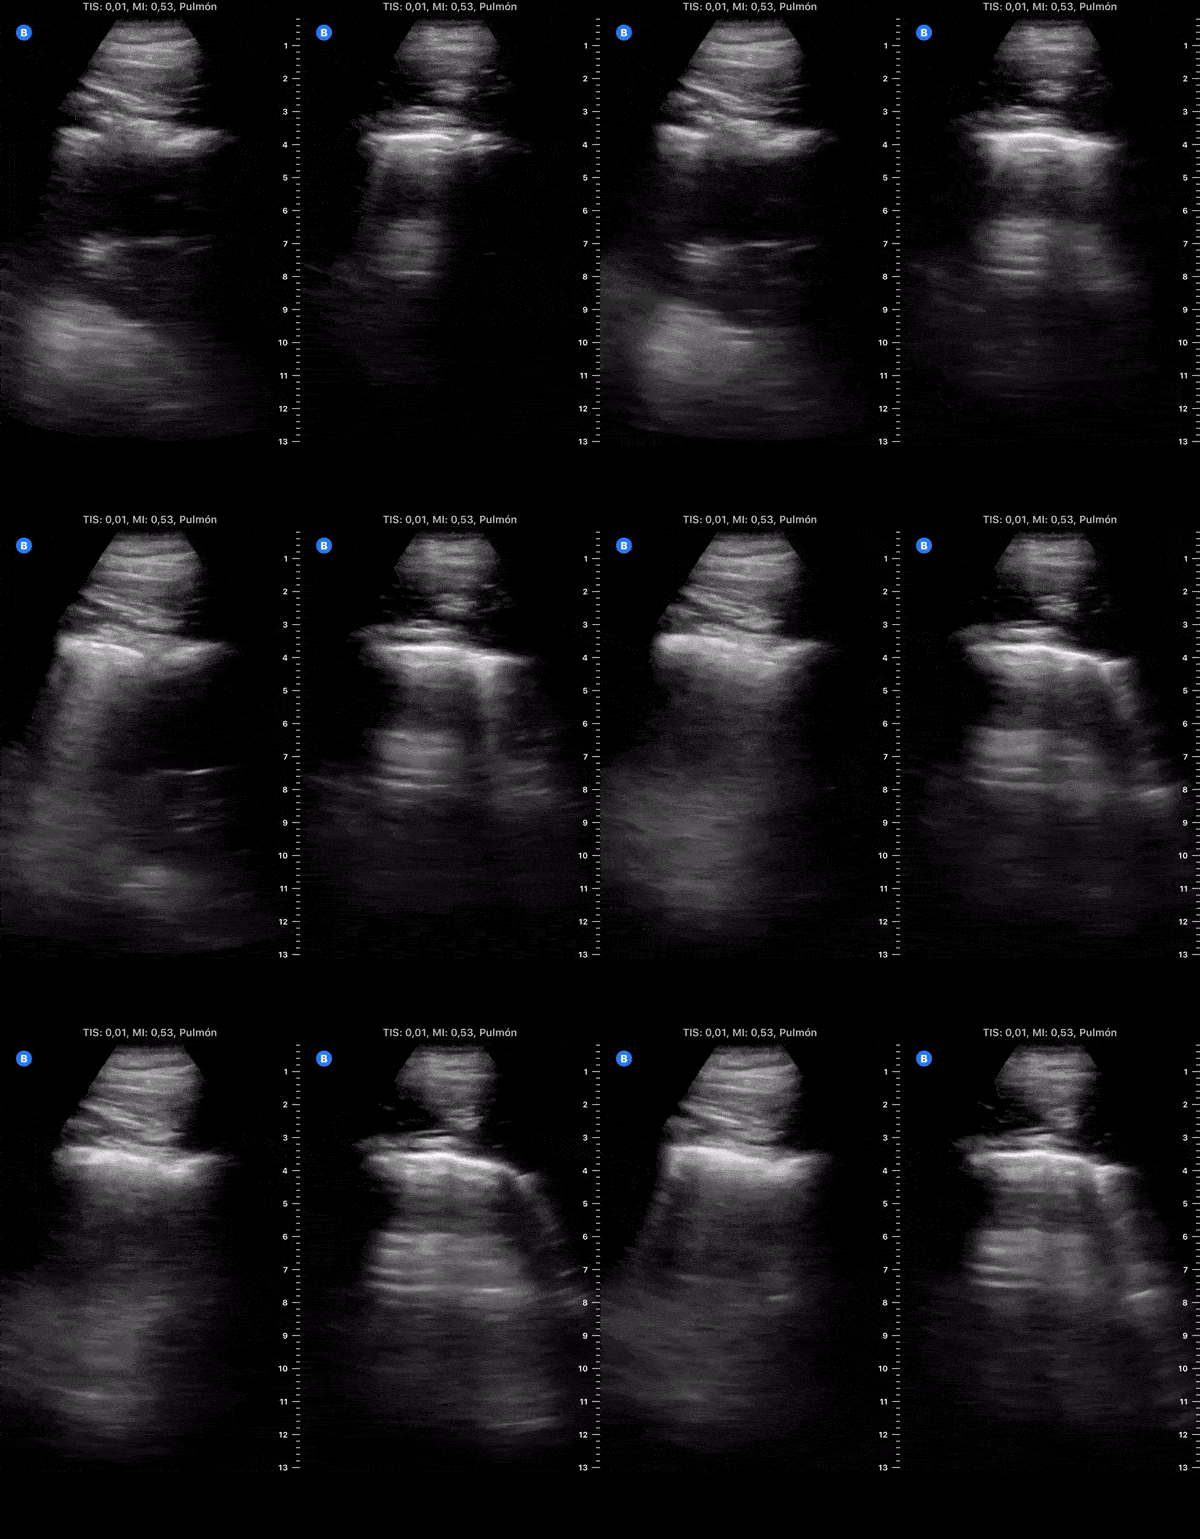
Day 17 after #COVID diagnosis. Less cough, nausea & more appetite, energy. No fever or dyspnea. SpO2 97%. #POCUS update: right side resolved, left lateral & lower less thickened pleura & B-lines.
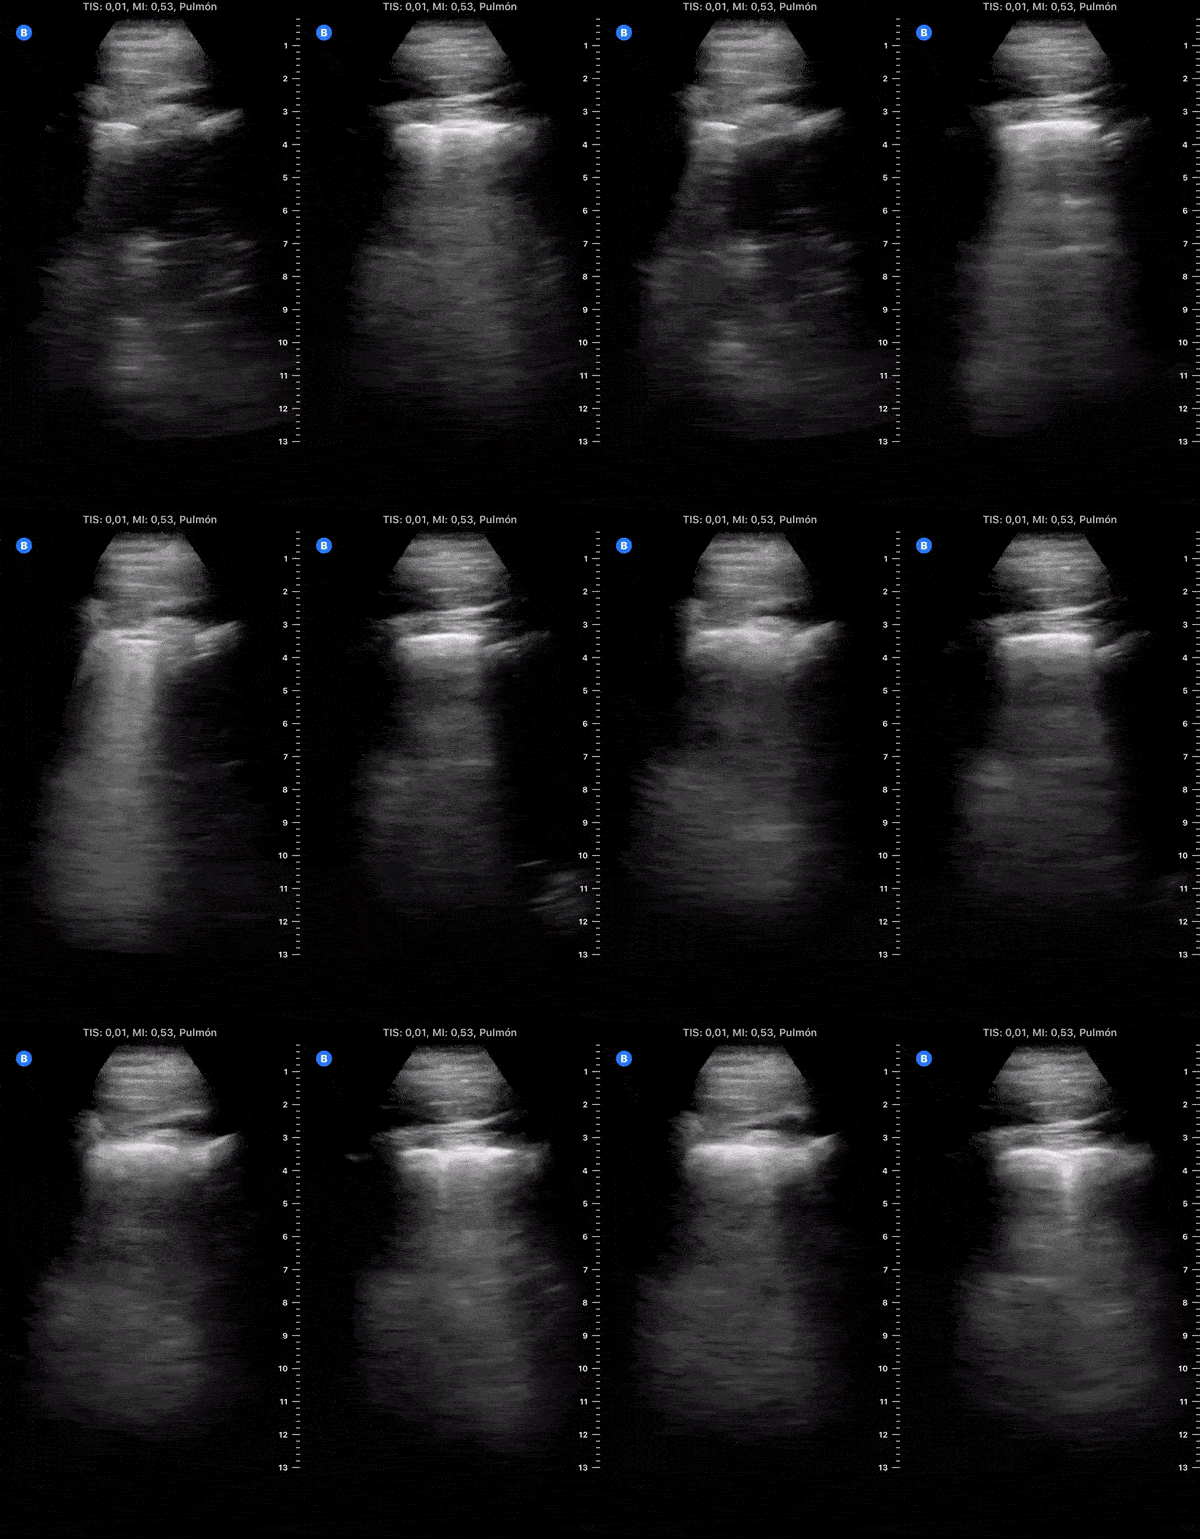
Day 18 after #COVID diagnosis. Similar cough. No fever or dyspnea. SpO2 97%. #POCUS update: slight worsening. Bilateral thickened pleura & B-lines, subpleural consolidation reappeared. On HCQ (D14). Waiting to re-test on friday.
@yaletung
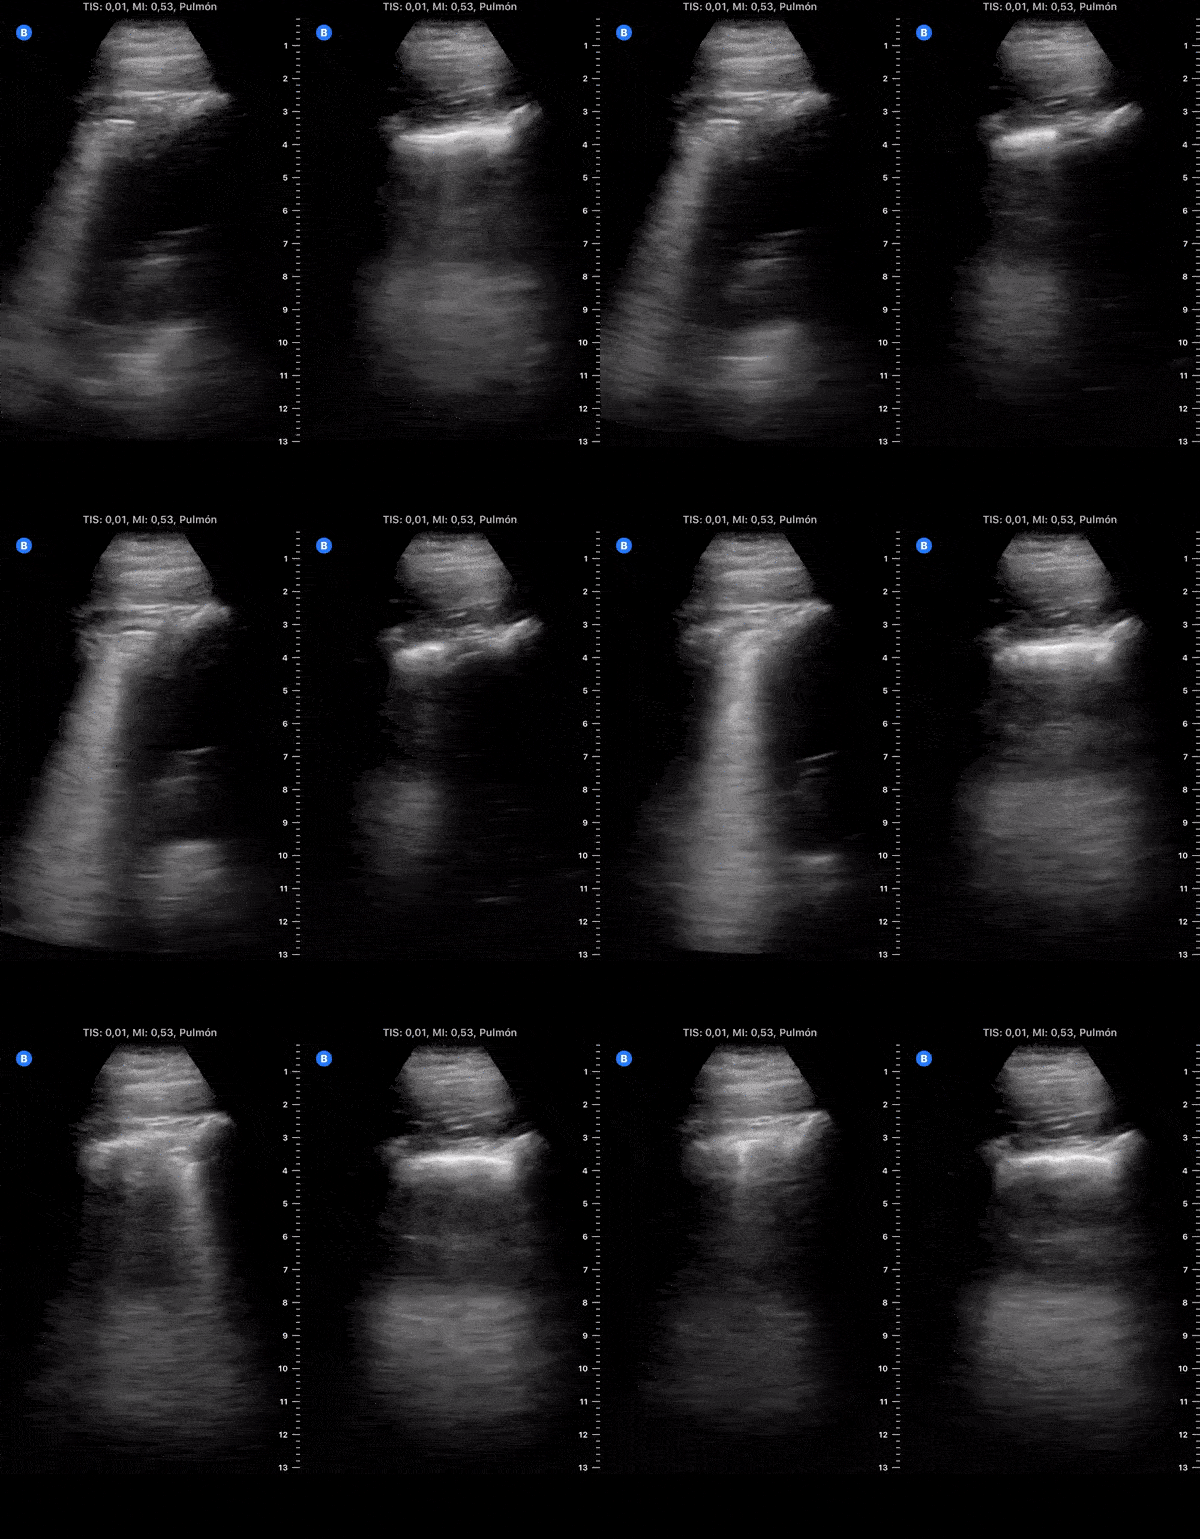
Day 19 after #COVID diagnosis. More cough & weakness. No fever or dyspnea. SpO2 97%. #POCUS update: Subpleural consolidation got bigger on left lower lobe. Yesterday started levofloxacin (bacterial super infection?).
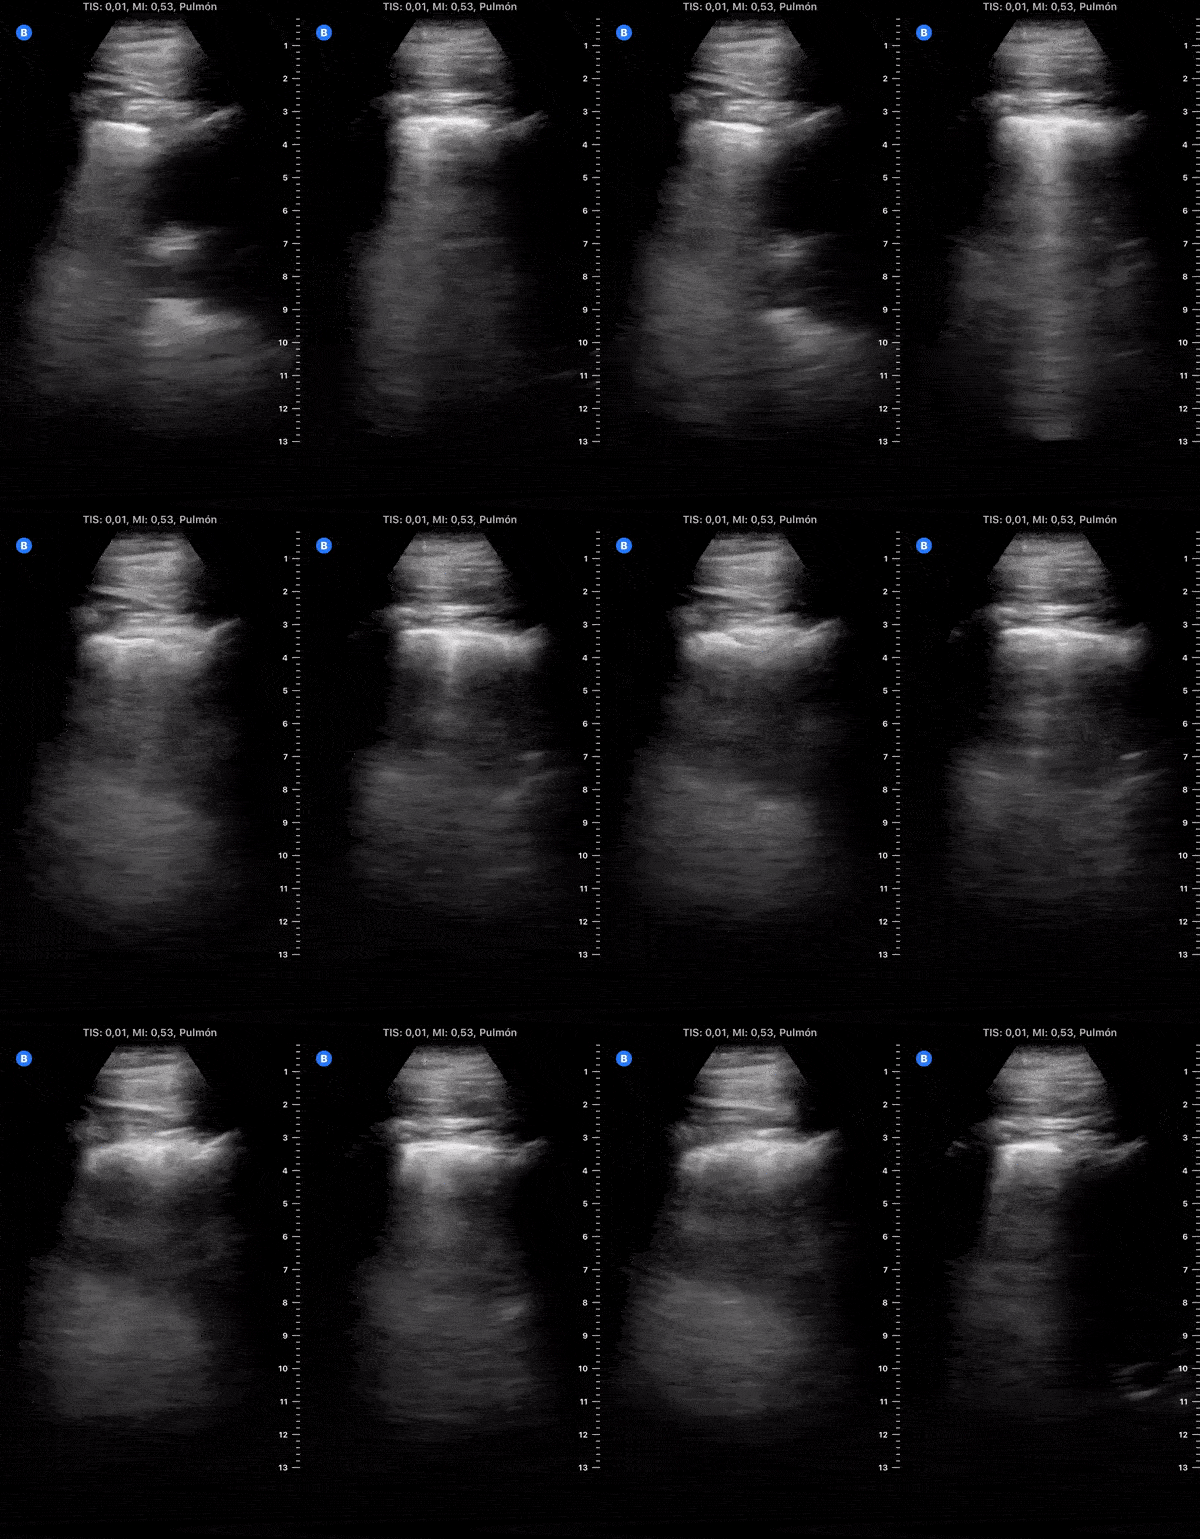
Day 20 after #COVID diagnosis. Almost recovered. SpO2 96%. #POCUS update: Significant improvement, remains thick pleura & B-lines. Yesterday tested NEGATIVE. I will try update a lung scan every week. FINALLY, I am returning to the TRENCHES.
More Images of Lung Ultrasound
COVID-19 Lung Ultrasound Findings
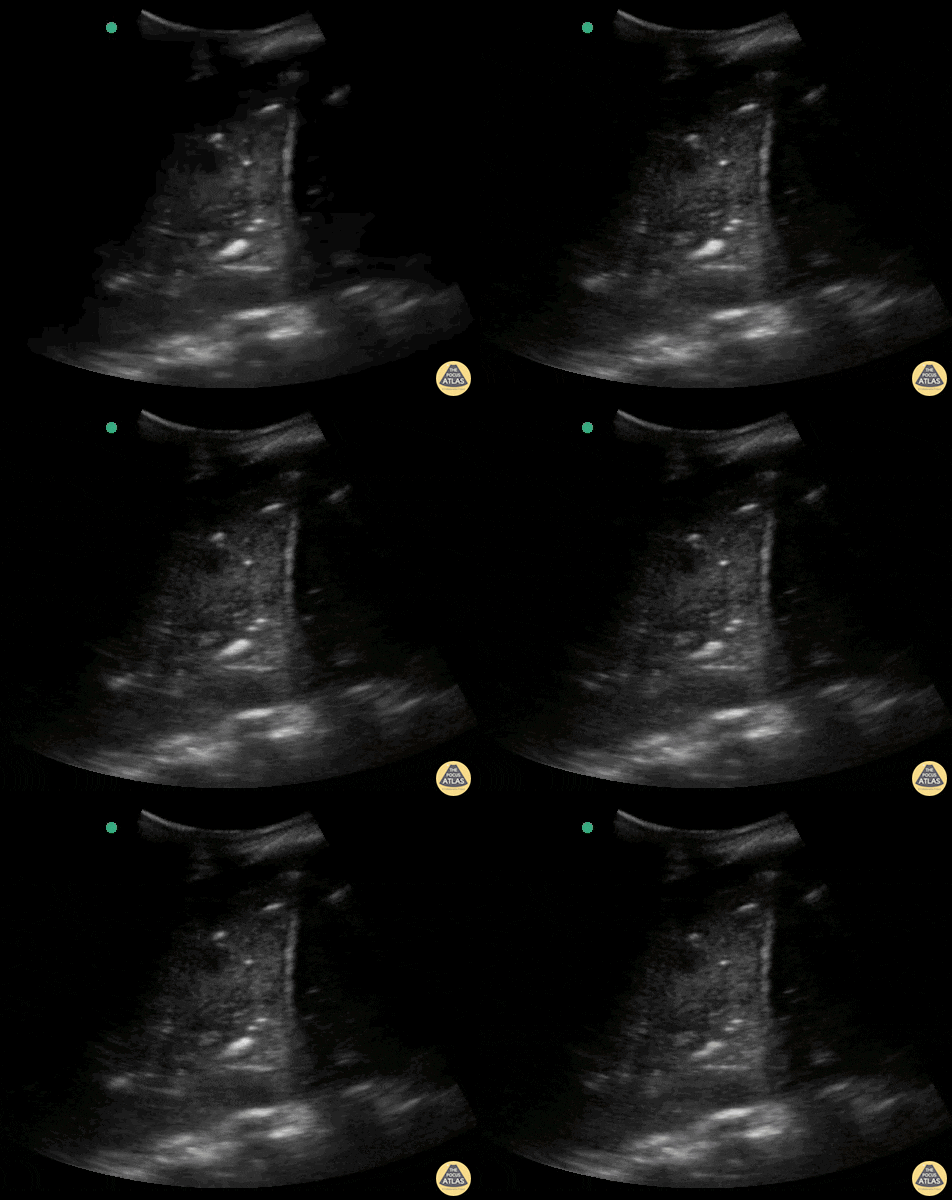
Massive lung consolidation in a patient diagnosed with COVID-19 with bacterial component.
Contributor: Rafael Intensivanaveia - Critical Care Physician at Hospital Israelita Albert Einstein
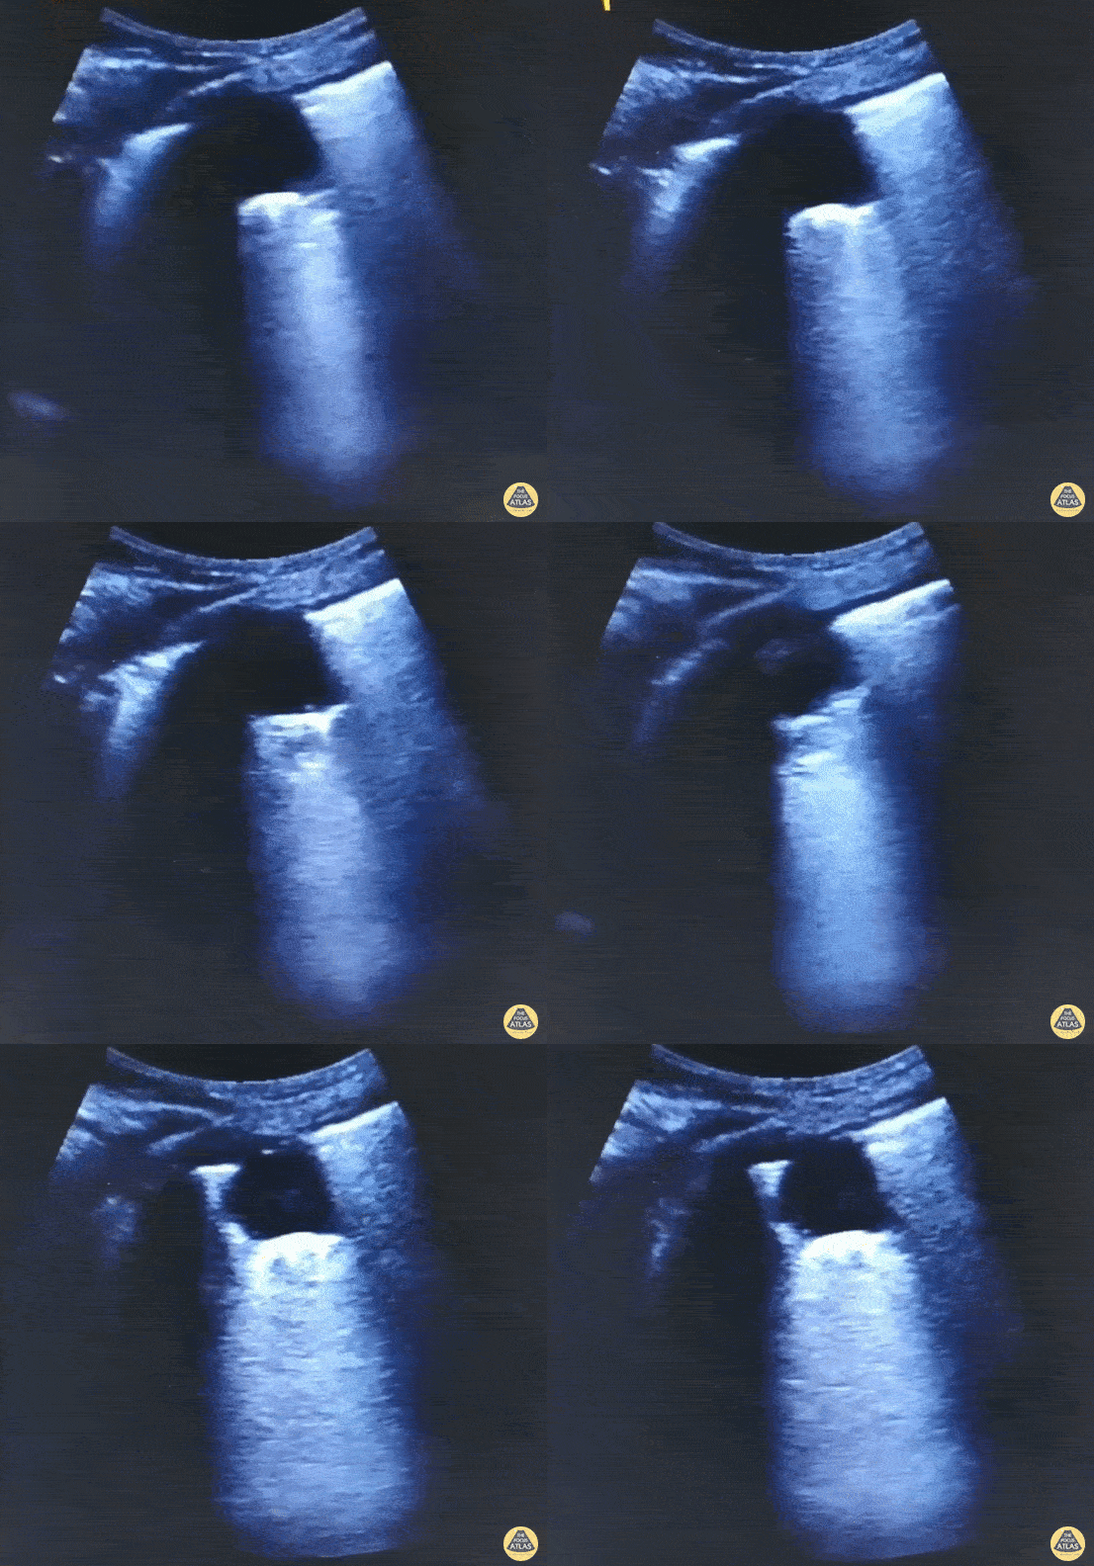
Subpleural consolidation (shred sign) in a COPD patient with Covid 19, admitted to the ICU with acute respiratory failure progressing to intubation and mechanical ventilation.
Contributor: Bruno Souza @BrunoSo03038122
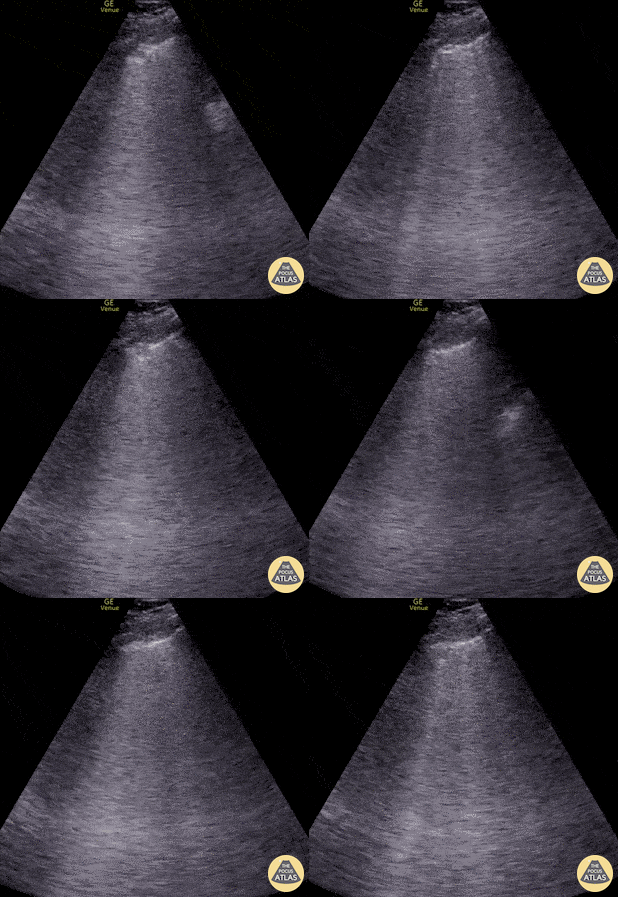
Seen here is an irregular and thickened pleural line with associated focal and confluent B lines in a patient with COVID-19 pneumonia.
Edgar Miranda
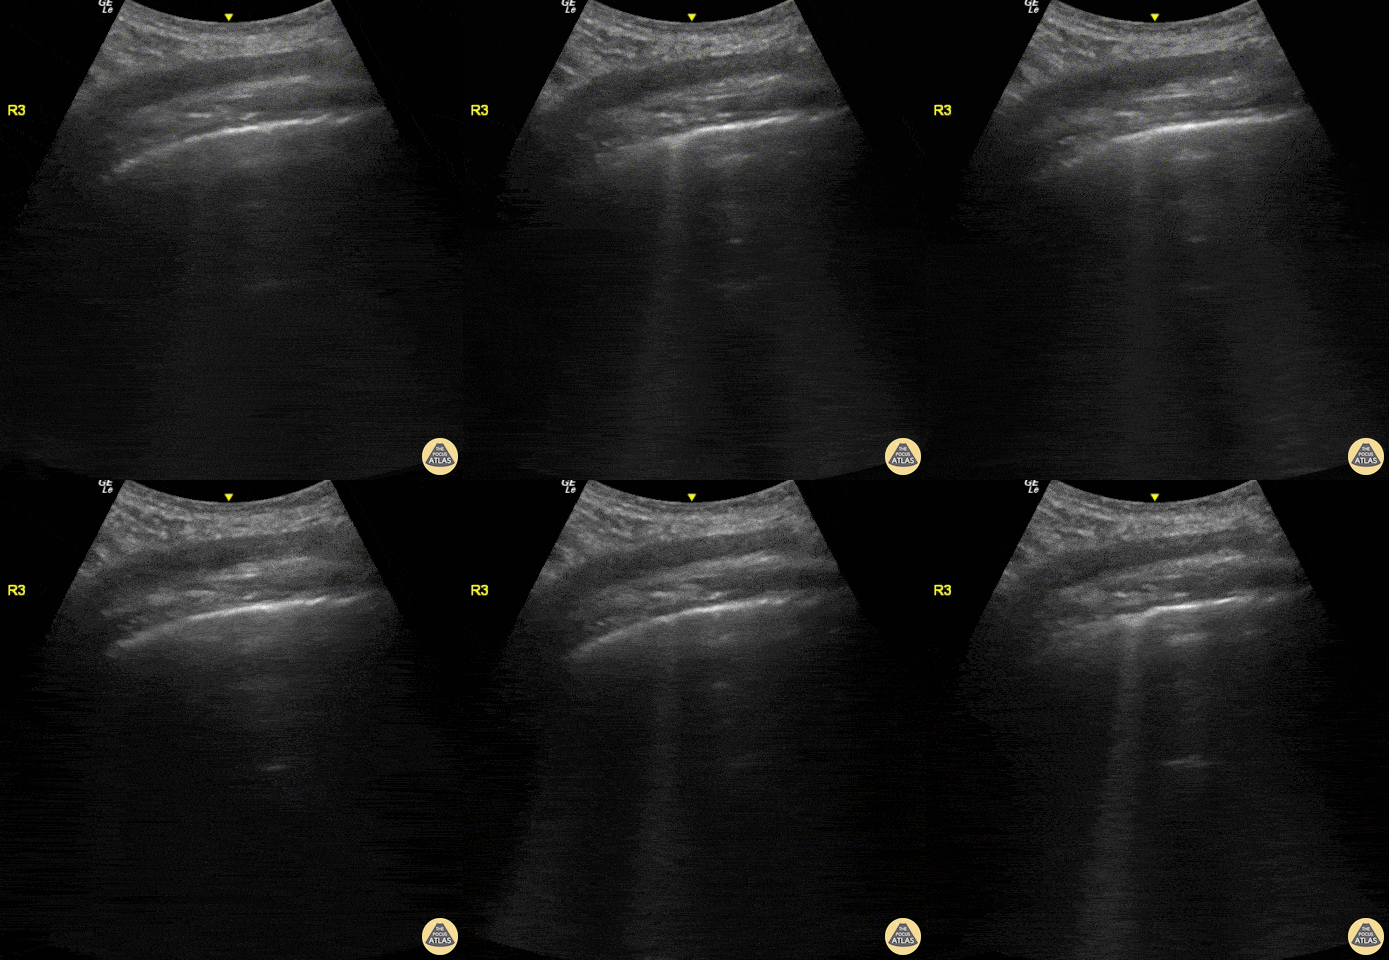
This image was taken from a 58-year-old man with cough and fever x 8 days who tested positive for SARS-CoV-2 Virus.
Pictured here is a POCUS view (R3 Zone) obtained in oblique position with a curvilinear probe. Appreciate the lung sliding, regular pleural line, and alternating multiple separated B-lines and A-lines; this constellation of findings is referred to as “Light Beam Sign”.
Renato Tambelli, Emergency Physician, Hospital das Clínicas de Marília, Brazil
@R_Tambelli / @JediPocus
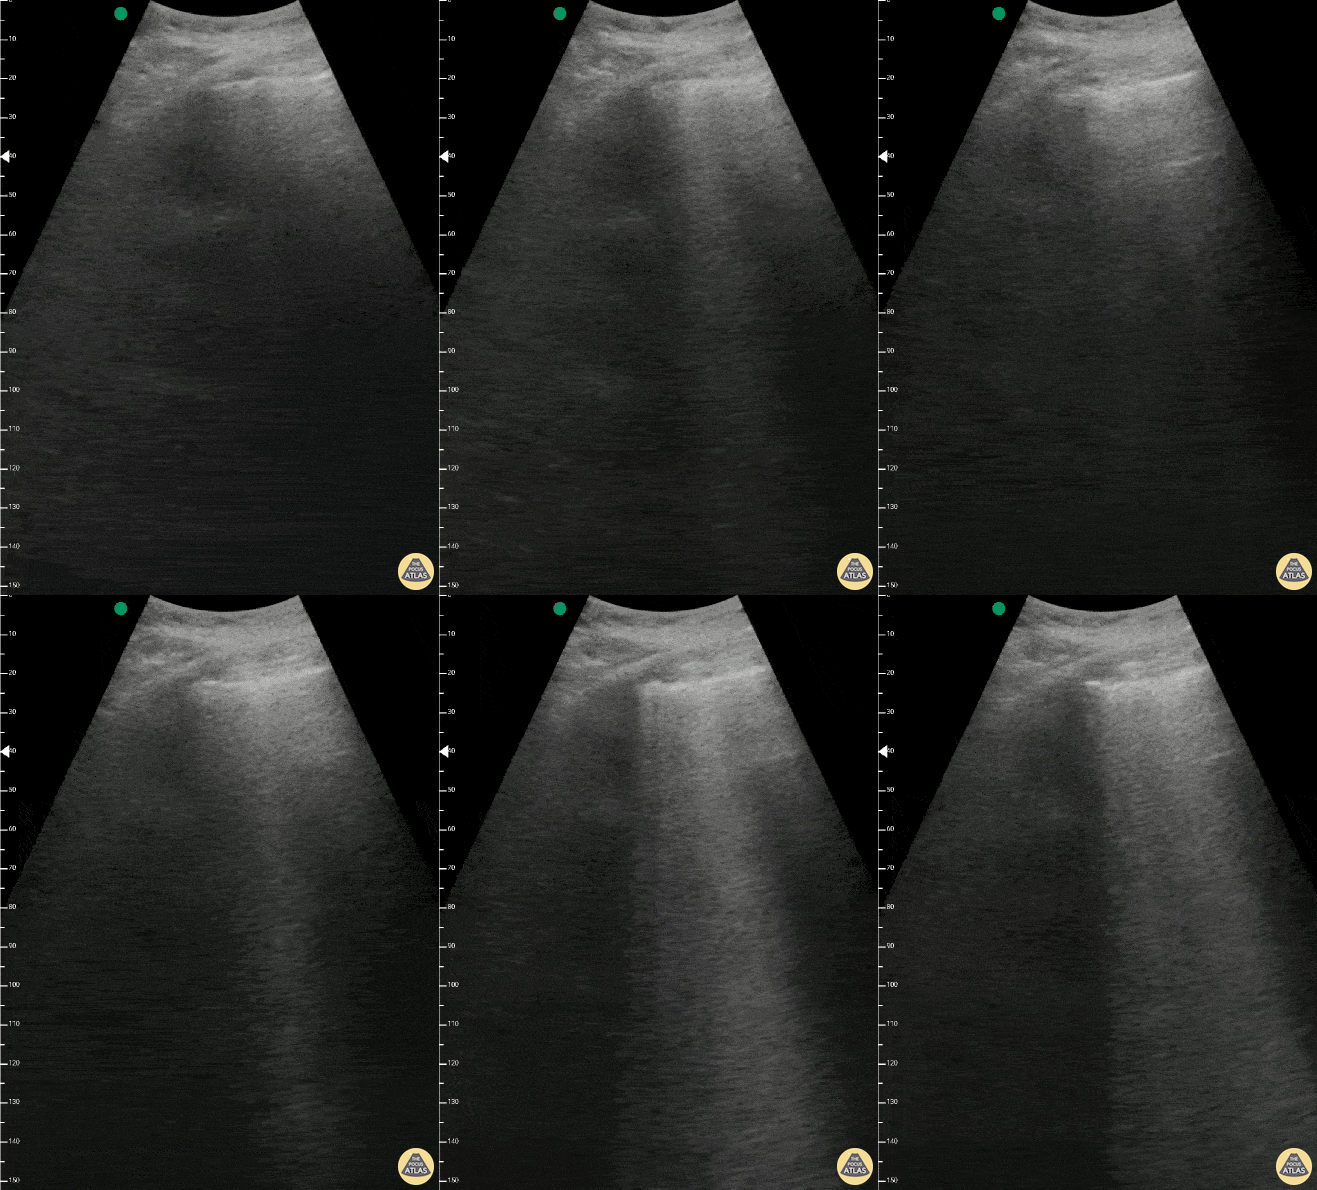
Seen here is a "Light Beam Sign" in a patient with COVID-19 pneumonia. The on-and-off effect of the hyperecchyoic vertical artifact is believed to occur as a result of ground glass alterations in lung parenchyma. At times the light beams or B-lines cover A-lines; and at other times the A-lines remain visible in the background.
Renato Melo, Emergency Physician at Hospital das Clínicas de Marília-SP, Brazil. Co-founder of Pocus Jedi
@Renato_Melo_
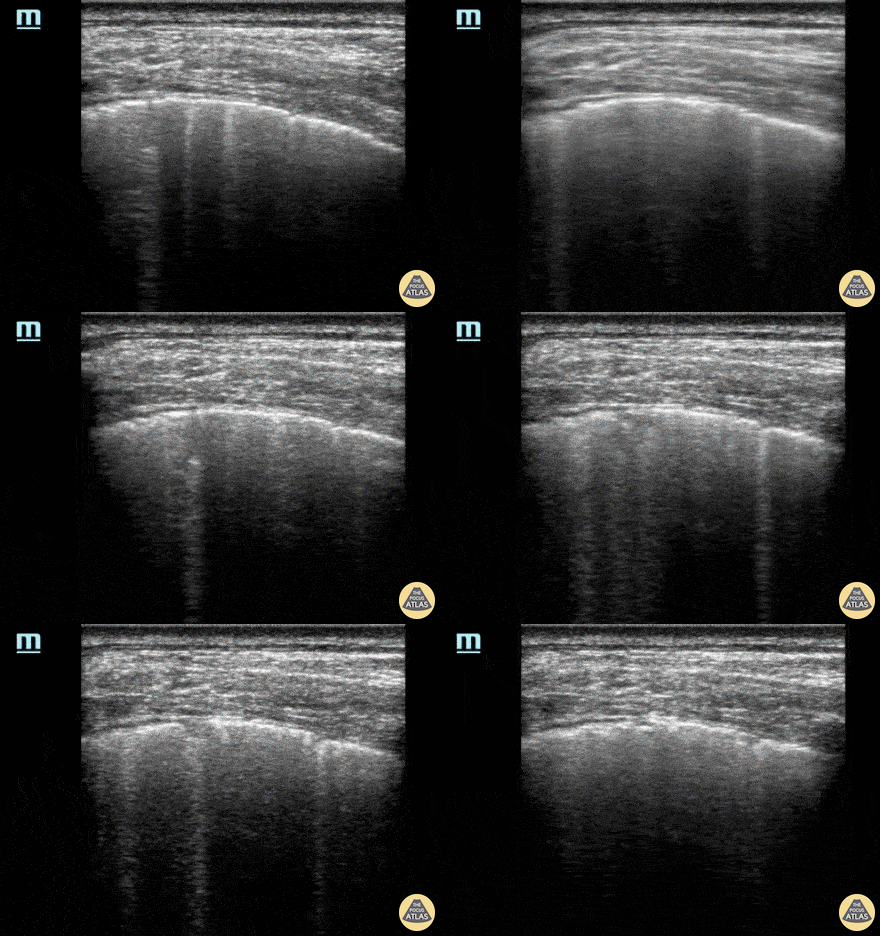
An elderly male presented from home with complaints of mild confusion, non-specific abdominal pain, and a 3-day history of dyspnea. He required no supplemental oxygen. 12-lung zone ultrasound was performed using the linear transducer. Zone R5 revealed the pictured confluent B-line pattern and small areas of consolidation. Patient subsequently tested positive for the SARS-CoV-2 virus.
Cian McDermott, Emergency Physician Dublin, Ireland
@cianmcdermott
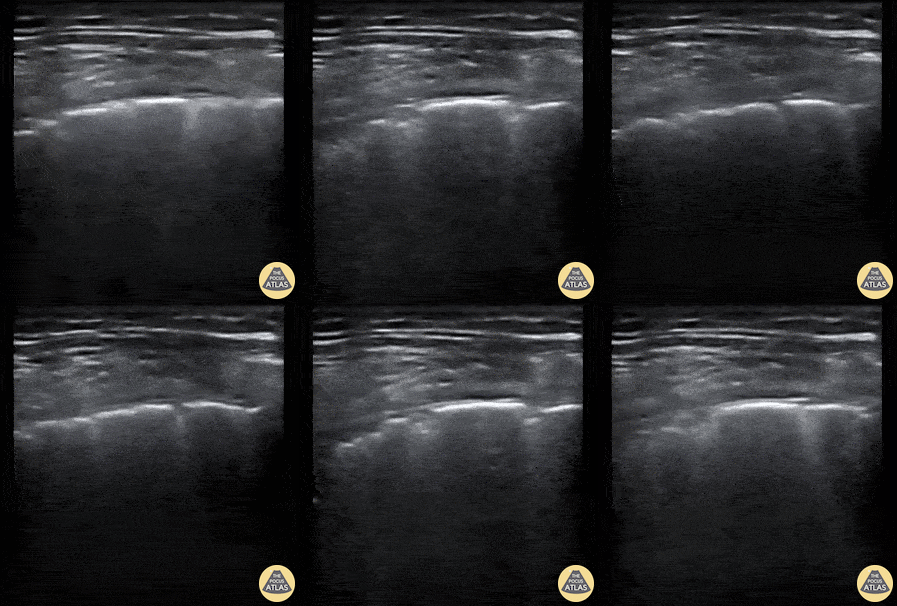
Patient presented to the Emergency Department with 2-day history of worsening dyspnea and increased work of breathing. He was profoundly hypoxic upon arrival with EMS (O2 sat on 2L via nasal prongs was 42%; improved to 75% upon switching to high flow nasal cannula at 40L/min). A 12-zone lung ultrasound was performed using a linear probe and what is pictured is from L6 (left inferior posterior zone). You can appreciate the coarse irregular pleura, patchy B-lines, and and small areas of consolidation. Findings are typical for clinically-suspected COVID-19 pneumonitis.
Cian McDermott, Emergency Physician; Dublin, Ireland
@cianmcdermott
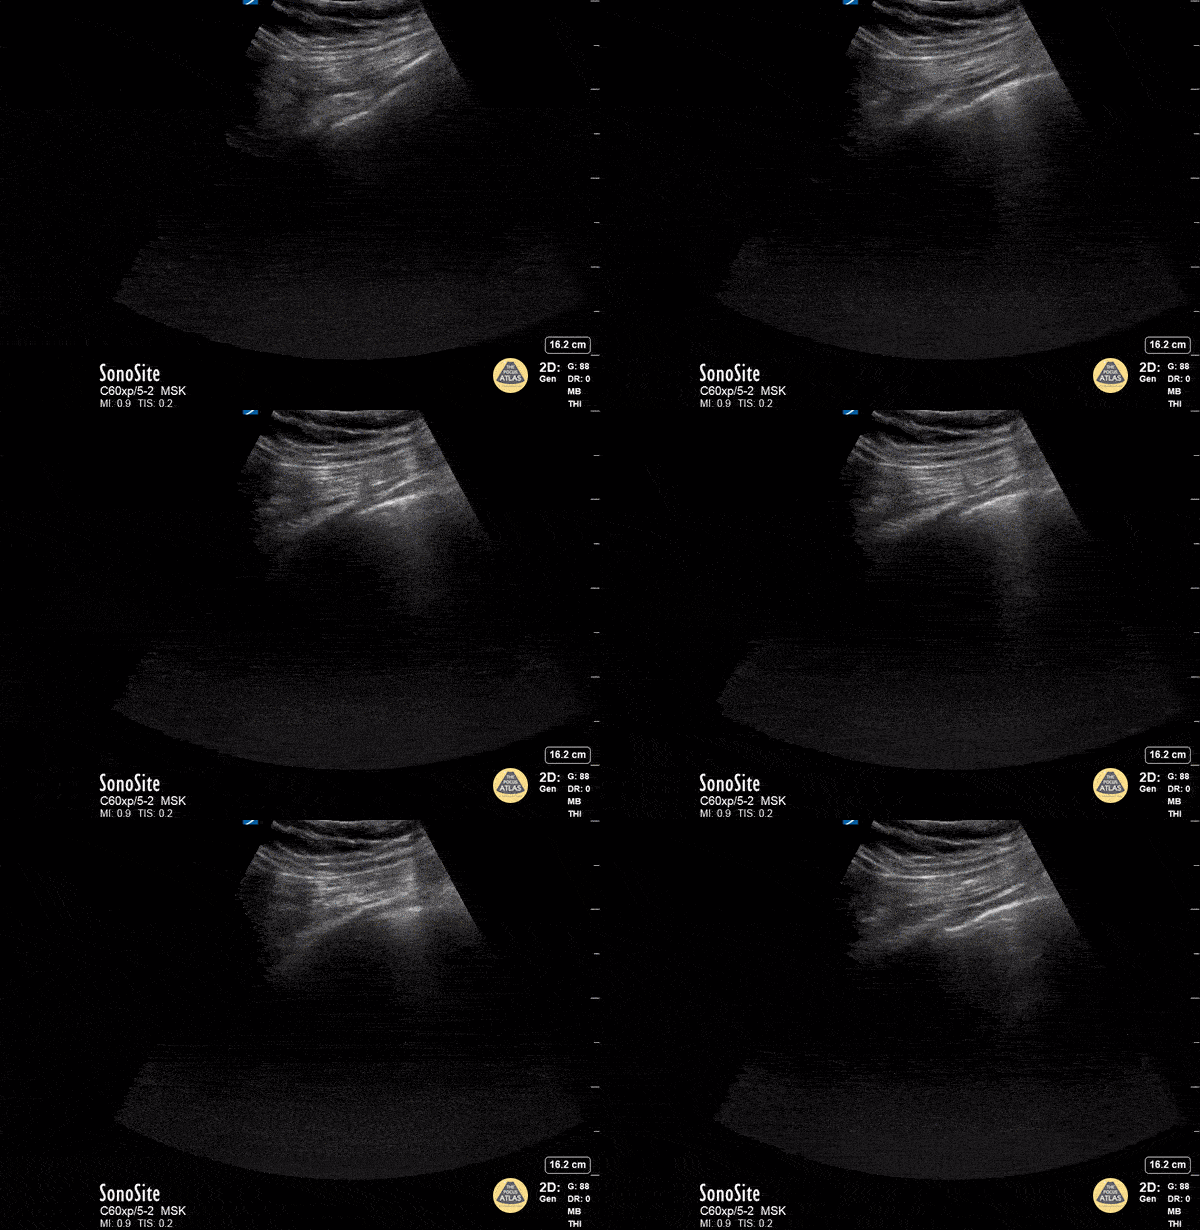
This lung ultrasound shows a "light beam" artifact, a single shining band-form from a regular pleura that appears and disappears with spontaneous respirations. Note also the presence of A-lines. This is highly specific of early COVID-19 infection as described by Volpicelli.
Image courtesy of David Hansen, DO & Therese Mead, DO, RDMS, FACEP
Central Michigan University
Twitter handle: @davidbhansen
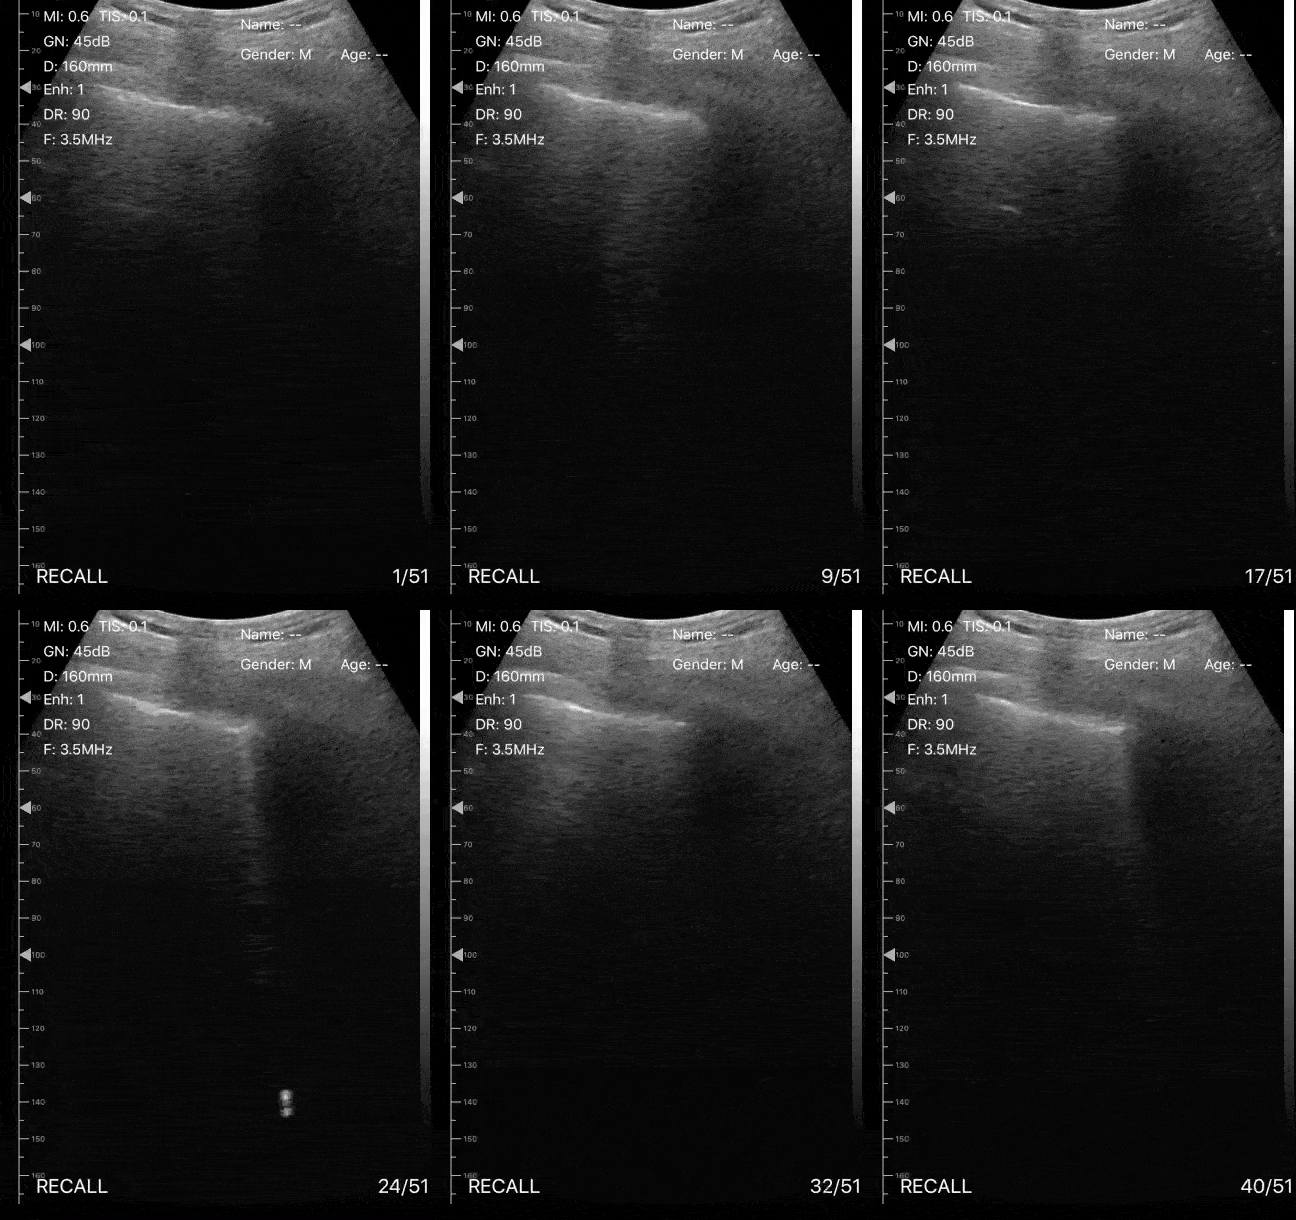
This clip demonstrates the presence of focal B lines with pleural irregularity. The patient presented to the ED with cough and O2 saturation varying between 87-89%, with no respiratory distress or significant past medical history. One of the patient’s family members was currently under investigation for COVID-19. The entire lungs were examined and the image above is the PLAPS view. Later the patient had a CT done which showed ground-glass opacity peripherally compatible with areas scanned on the POCUS exam.
Pearl: POCUS may be an excellent tool for the triage of these patients.
Image Courtesy of Dr. Victor Bang (@vmjbang)
Co-Founder of Pocus Jedi
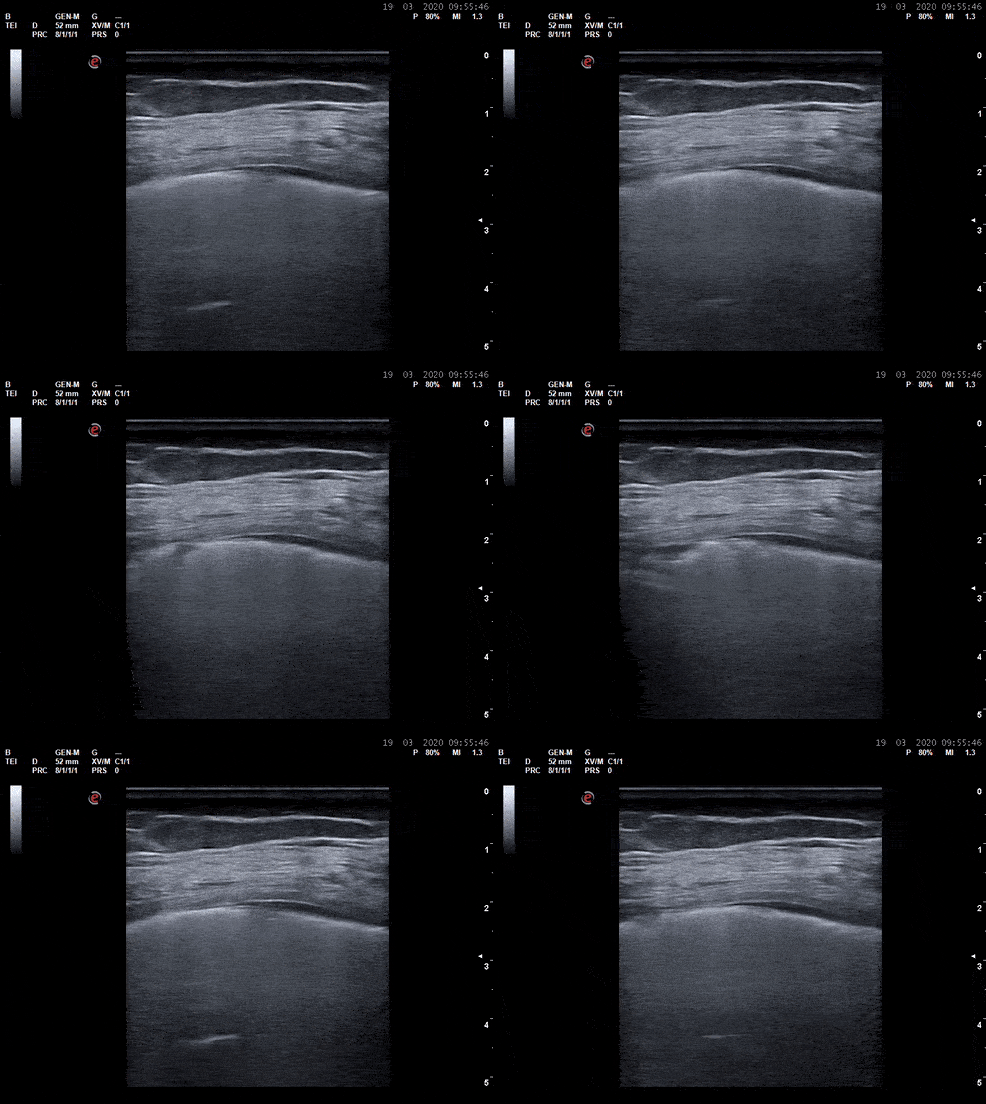
Lung ultrasound performed in a COVID+ patient. Note the clustered B lines, patchy shredding (depression) and thickening of pleural line, and small sub-pleural consolidations.
Image courtesy of Dr. Marco Garrone (@drmarcogarrone)
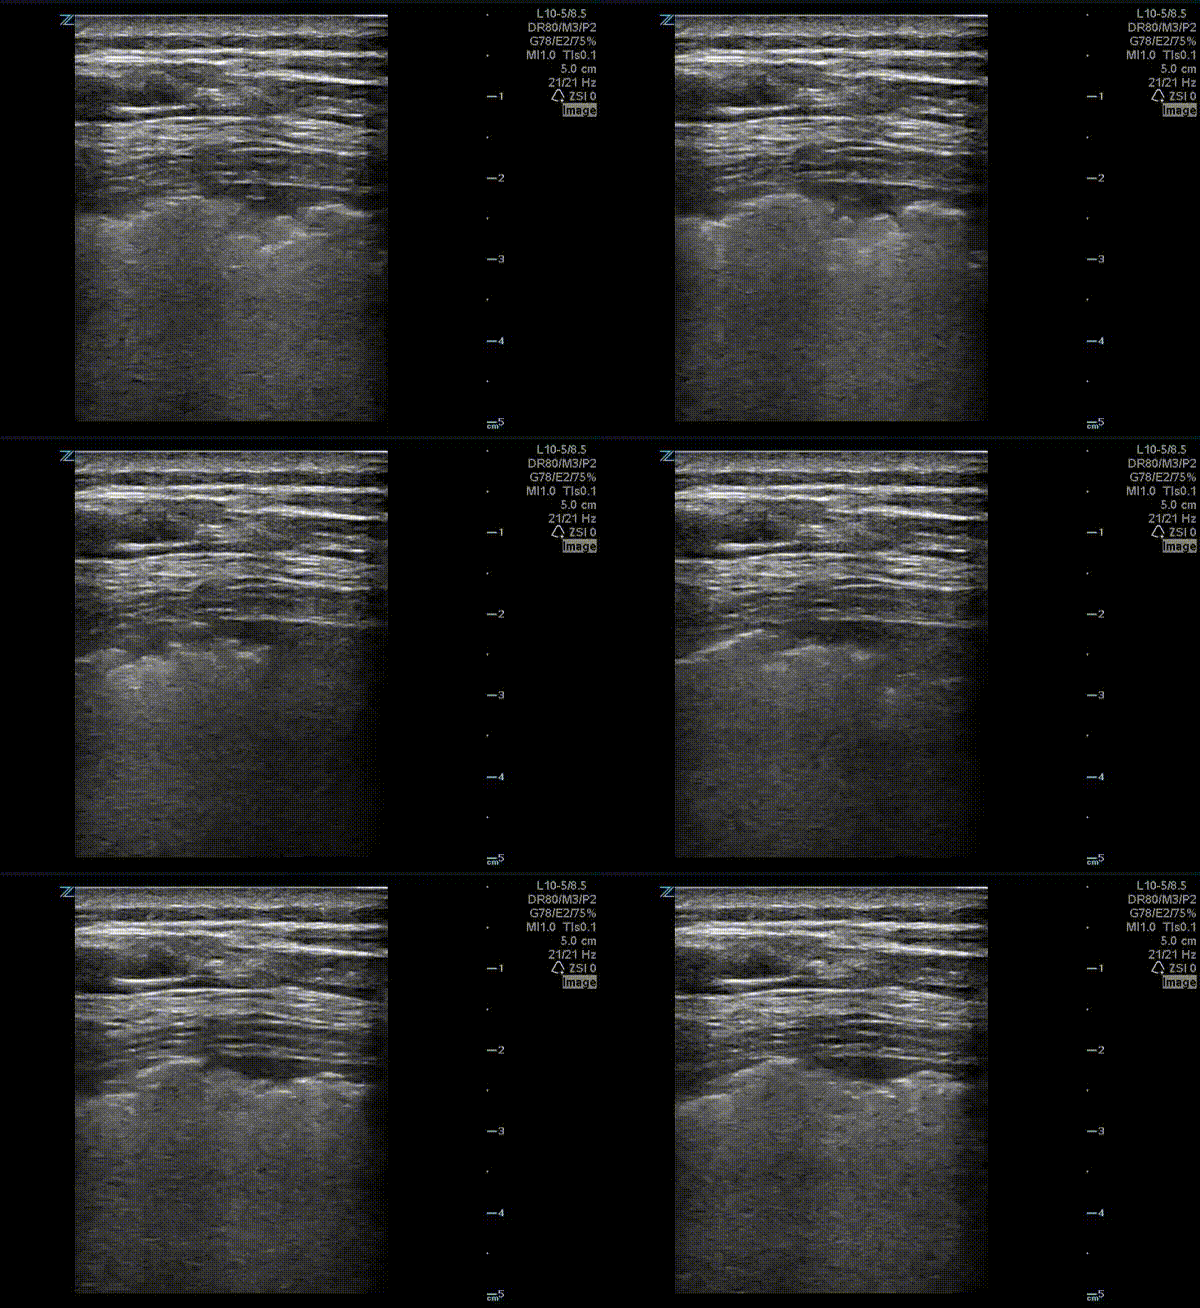
This is a lung ultrasound performed on a patient with COVID-19. The patient had no prior pulmonary disease. They presented with mild tachypnea and hypoxia. A chest x-ray revealed diffuse interstitial and patchy airspace densities. This ultrasound clip shown demonstrates an irregular pleural line with subpleural nodular consolidation and waterfall B-lines.
Image courtesy of Dr. Eric Abrams (@eabramsMD)
![A COVID-19 Patient with 3 days of Symptoms [1/3]](https://images.squarespace-cdn.com/content/v1/58118909e3df282037abfad7/1584923302263-T9LBTKNFW294TEL8OU0L/ezgif.com-optimize+%2843%29.gif)
This is an ultrasound clip of the right upper lobe of a patient with confirmed COVID-19 pneumonia. The patient presented to the emergency department on day 3 of symptoms with fever. They were found to be tachypneic and with mild hypoxia. [Clip 1/3]
Lung ultrasound demonstrates confluent B lines associated with thickening and irregularity of the pleural line. A thin parapneumonic effusion can also be appreciated here.
Image courtesy of Fritz Fuller (@POCUS_Society)
![A COVID-19 Patient with 3 days of Symptoms [2/3]](https://images.squarespace-cdn.com/content/v1/58118909e3df282037abfad7/1584923302390-3HOKDDGEEXWXTE1ZKHPK/ezgif.com-optimize+%2844%29.gif)
This is an ultrasound clip in a patient with confirmed COVID-19 pneumonia. The patient presented to the emergency department on day 3 of symptoms with fever. They were found to be tachypneic and with mild hypoxia. [Clip 2/3]
Lung ultrasound demonstrates patchy B lines associated with thickening and irregularity of the pleural line.
Image courtesy of Fritz Fuller (@POCUS_Society)
![A COVID-19 Patient with 3 days of Symptoms [3/3]](https://images.squarespace-cdn.com/content/v1/58118909e3df282037abfad7/1584923302992-4BOINIWQM3AMUCPWU745/ezgif.com-optimize+%2845%29.gif)
This is an ultrasound clip of the right posterior lung field of a patient with confirmed COVID-19 pneumonia. The patient presented to the emergency department on day 3 of symptoms with fever. They were found to be tachypneic and with mild hypoxia. [Clip 3/3]
Lung ultrasound demonstrates confluent B lines associated with a small subpleural consolidation.
Image courtesy of Fritz Fuller (@POCUS_Society)
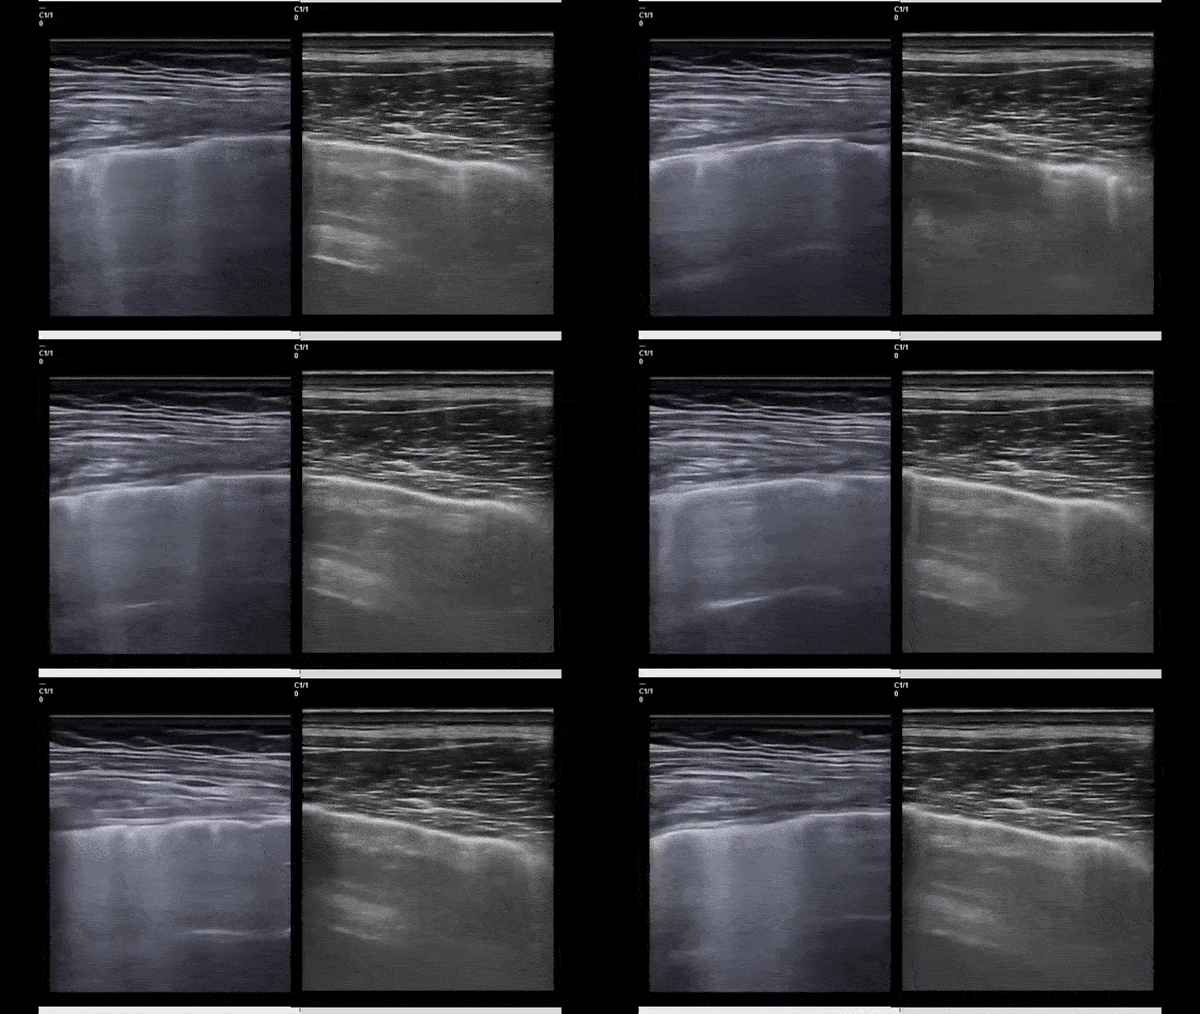
This side by side ultrasound clip compares B-lines in a patient with COVID-19 (left) and a patient with CHF (right). While subtle, the difference lies where the B-lines connect to the pleura! In COVID-19 many of the B-lines initiate from depressed/irregular areas of the pleura (imagine little holes being punched in the pleural line) while in CHF, the B-lines initiate from a smooth pleural line. These pleural defects are not specific to COVID -19 and can be seen in other viral pneumonia as well.
Take Home: Not all B-lines are created equal!
Image courtesy of Dr. Marco Garrone (@drmarcogarrone)
![Hospitalized COVID-19+ Patient on Day 9 of Symptoms [1/2]](https://images.squarespace-cdn.com/content/v1/58118909e3df282037abfad7/1585424289744-RG5K8531BSVL0L2IF4NT/ezgif.com-optimize+%2848%29.gif)
These clips are taken from a patient admitted with COVID-19 pneumonia. The patient was on day 9 of symptoms. His cough had improved and fever resolved however he had hypoxia requiring supplemental oxygen.
Left clip: Lung ultrasound of right lower lobe demonstrating thickened irregular pleura, diffuse b lines (confluent) with scattered puntate subpleural consolidation and small effusion overlying pleural effusion.
Right clip: Lung ultrasound of right upper lobe demonstrating a moderate subpleural consolidation with air bronchograms present.
Image courtesy of Fritz Fuller (@POCUS_Society)
![Hospitalized COVID-19+ Patient on Day 9 of Symptoms [2/2]](https://images.squarespace-cdn.com/content/v1/58118909e3df282037abfad7/1585424468095-8K5EKTWKAPOC1EYA9OAN/ezgif.com-optimize+%2849%29.gif)
These clips are taken from a patient admitted with COVID-19 pneumonia. The patient was on day 9 of symptoms. His cough had improved and fever resolved however he had hypoxia requiring supplemental oxygen.
Lung ultrasound of left lower and left upper lobes demonstrating thickened irregular pleura, diffuse b lines (confluent) with subpleural consolidations.
Image courtesy of Fritz Fuller (@POCUS_Society)
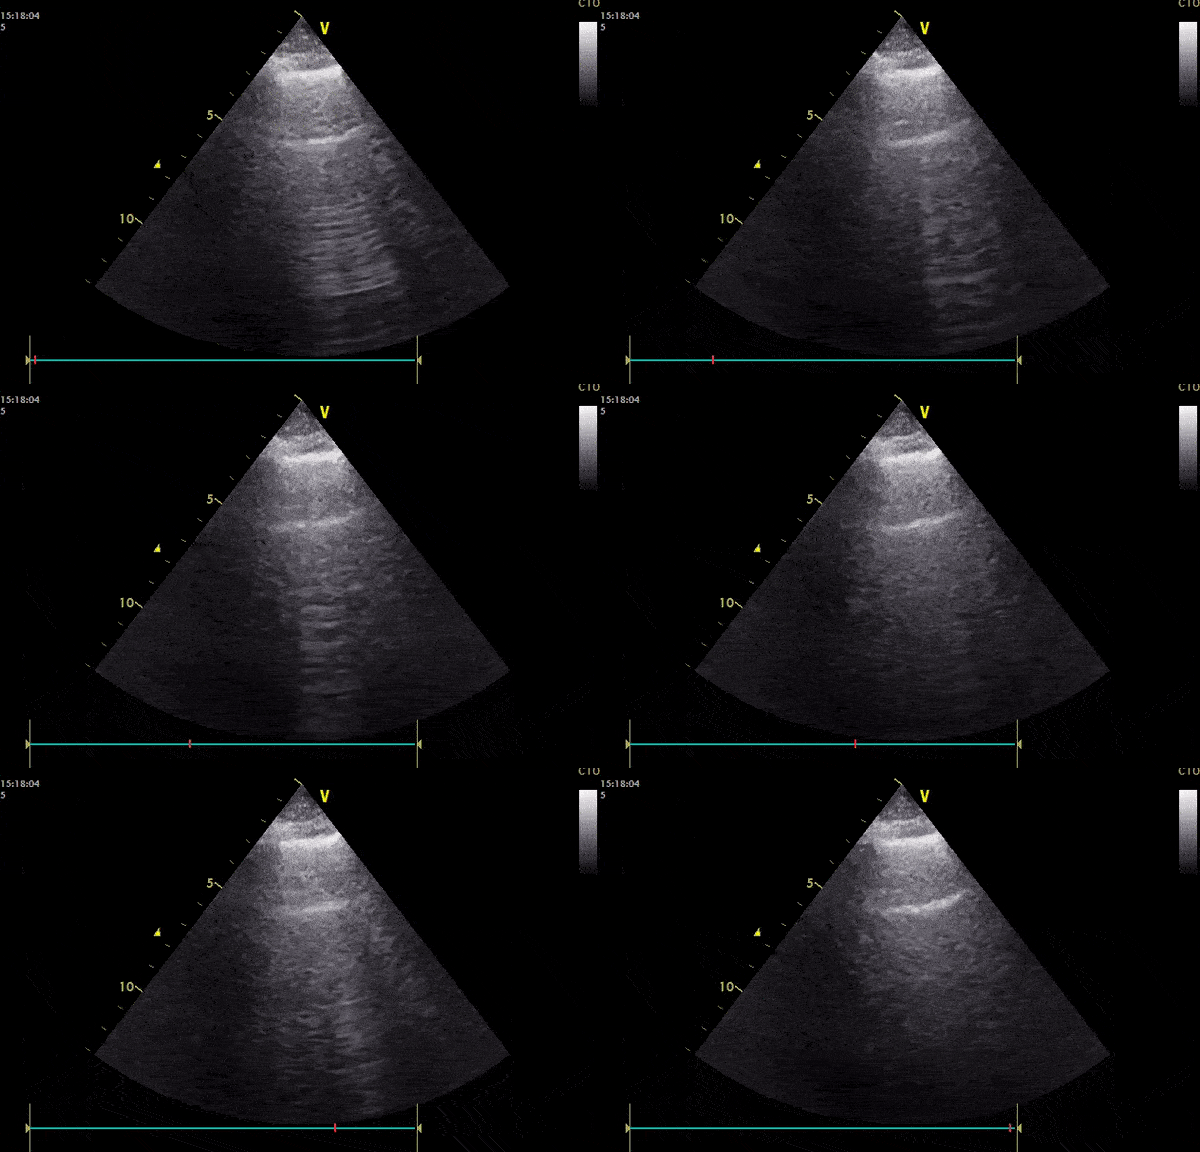
This is an ultrasound clip performed in a 57 year old male patient with known COVID-19 pneumonia. The patient presented with dyspnea and fever, he had an oxygen saturation of 94% on room air. The clip demonstrates an irregular pleural line with numerous B lines present. Interestingly, A-lines are also present that appears to be intermittently erased where B lines cross.
Image courtesy of Pierre Bernatas (@pb2316)
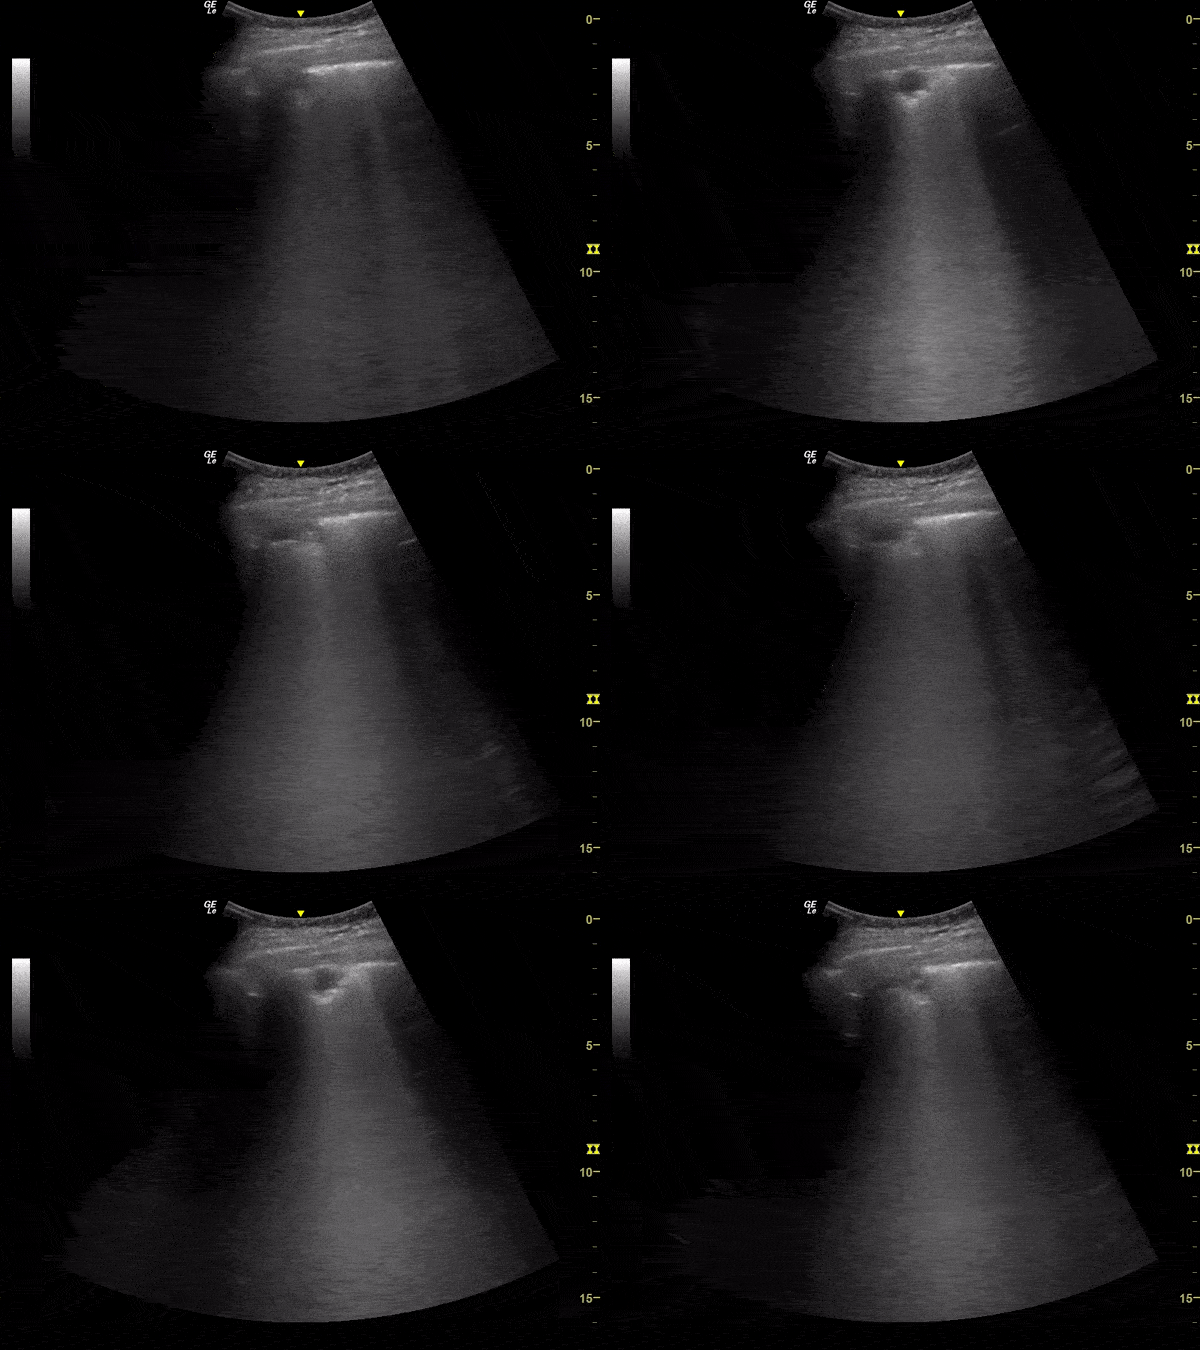
This lung ultrasound clip demonstrates a subpleural consolidation in a patient with suspected pulmonary involvement by COVID-19. The clip is taken from an exam performed on an elderly male with flu-like symptoms for 14 days with progressive respiratory failure.
Image courtesy of Renato Melo, Emergency Physician at Hospital das Clinicas de Marília-SP, Brazil. PocusJedi (@JediPocus) associated.
This lung ultrasound illustrates a small subpleural consolidation with associated waterfall b-lines in a patient with suspected COVID-19. The patient was a male in his mid 30s who presented to the ED with cough, but no fever. On admission the patient had an O2 saturation of 85%, with no respiratory distress.
Image courtesy of Dr. Victor Bang (@vmjbang)
Co-Founder of Pocus Jedi
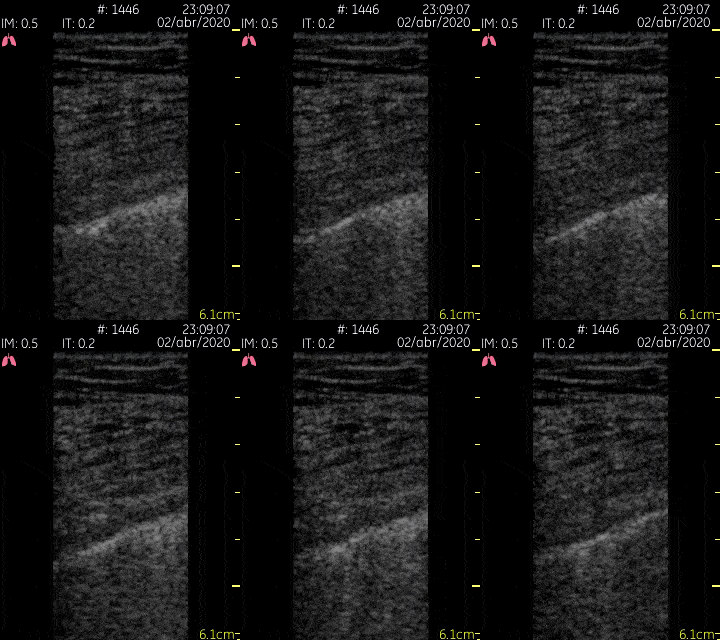
This lung ultrasound clip demonstrates multiple scattered b lines emanating from an irregular pleural line in a patient with known COVID-19.
Image courtesy of Dr. Jaime Alejandro Sánchez Gutiérrez (@pleuralpocus)
Normal Lung Ultrasound Anatomy
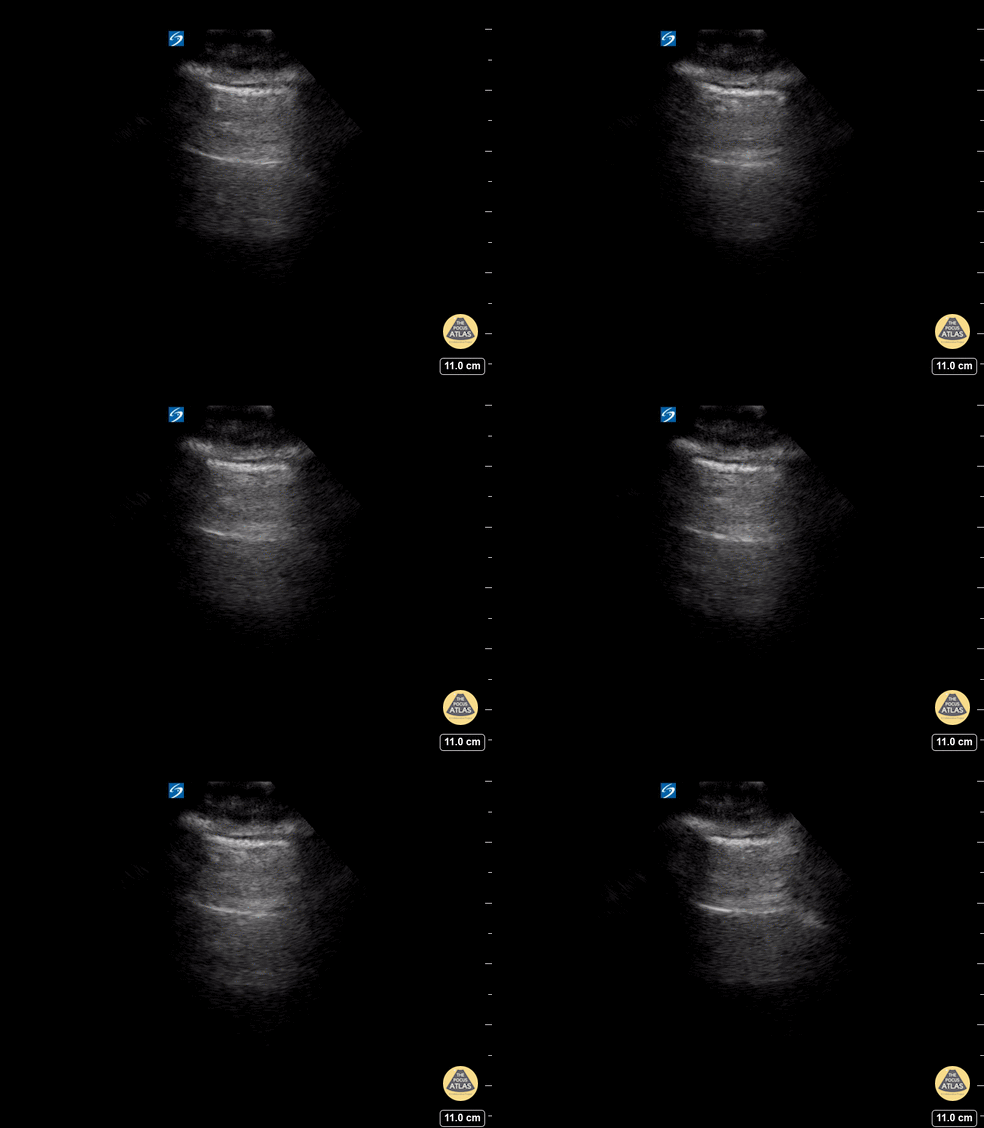
A lines appear as horizontal lines that represent normal aerated lung (dry interlobular septa). They are a reverberation artifact caused by the sound waves bouncing off the highly echogenic pleura and back to the probe, and repeating.
Hannah Kopinski (MS4) and Dr. Lindsay Davis - NYU Emergency Medicine, Matthew Riscinti - Kings County Emergency Medicine
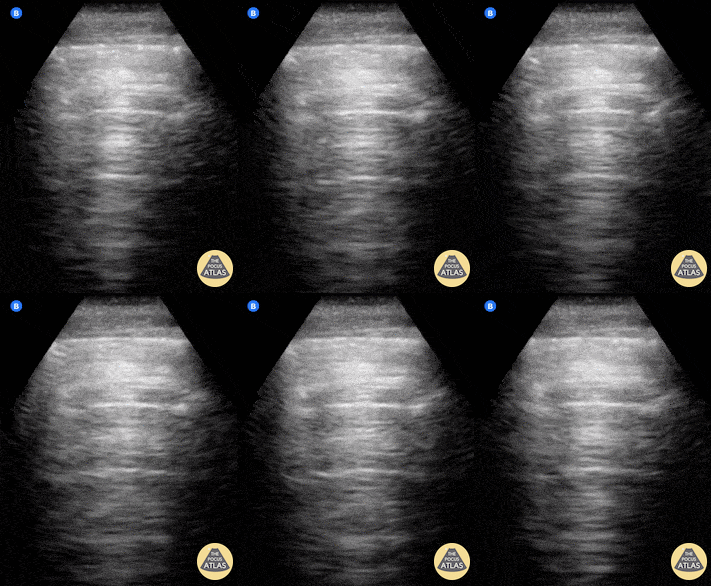
Lung ultrasound of a normal lung. Note both lung slide (shimmery, hyperechoic line on top of the screen, a result of parietal and visceral pleura sliding against each other) as well as multiple parallel A-lines (normal artifact from reverberation of the pleural line). The presence of lung sliding and no more than 3 B lines on lung ultrasound help exclude inersitital pulmonary edema and pneumothorax.
Shahad Al Chalaby, MD. PGY-2, Internal Medicine
Highland Hospital, Alameda Health System Internal Medicine Residency Program. CA, USA
@shahad_Chalaby
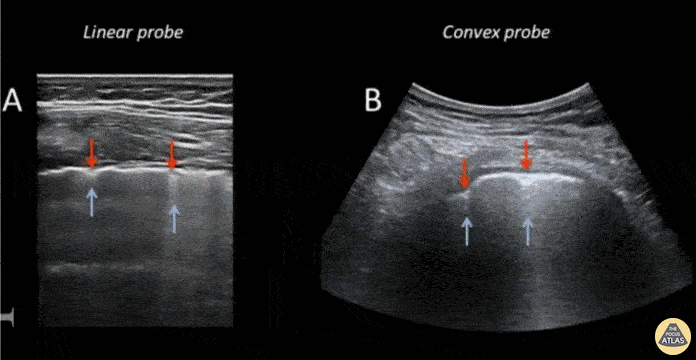
This still-shot image captures the differences in view as obtained using a linear vs curvilinear to assess a lung window.
Submitted by Anibal Artero
@ECOPULMONAR
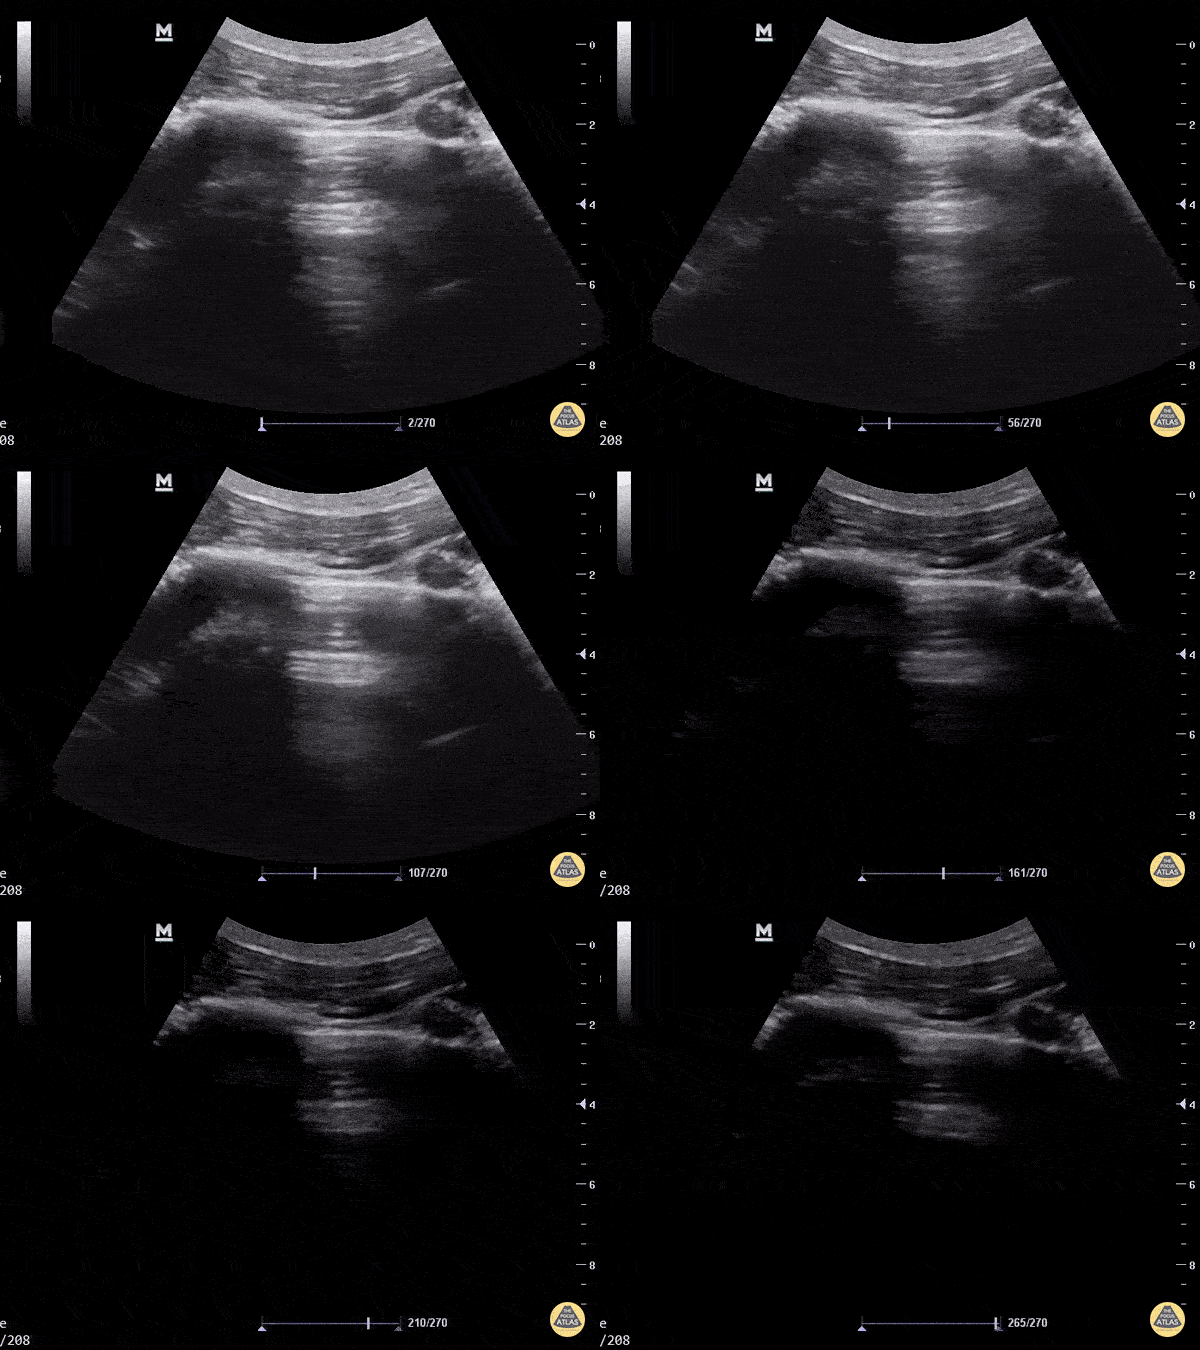
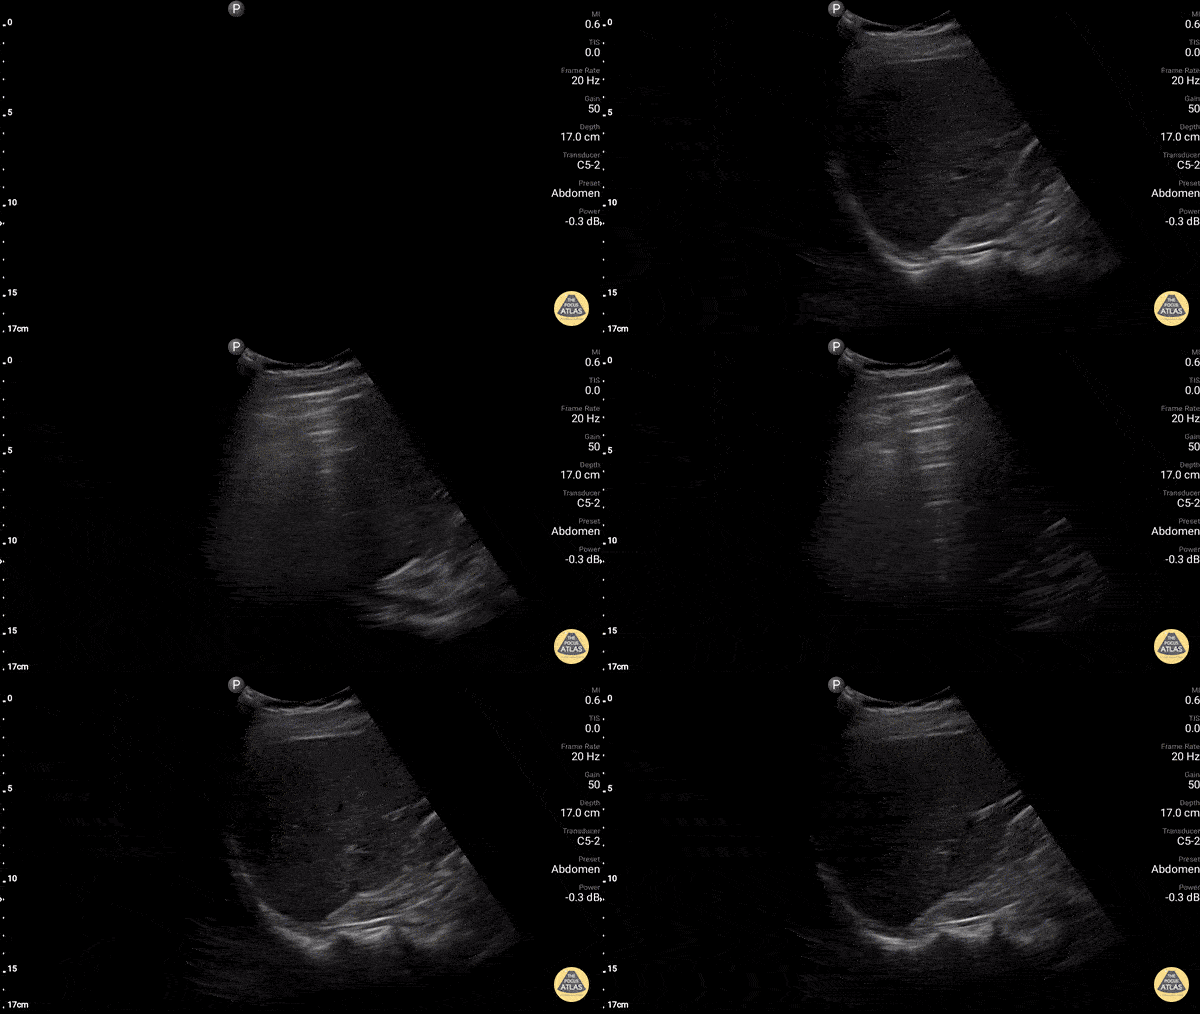
Normal lung demonstrating the "lung curtain." As the patient takes a deep breath, the "dirty shadowing" of a normal air-filled lung comes over the liver like a curtain.
Dr. Gordon Johnson
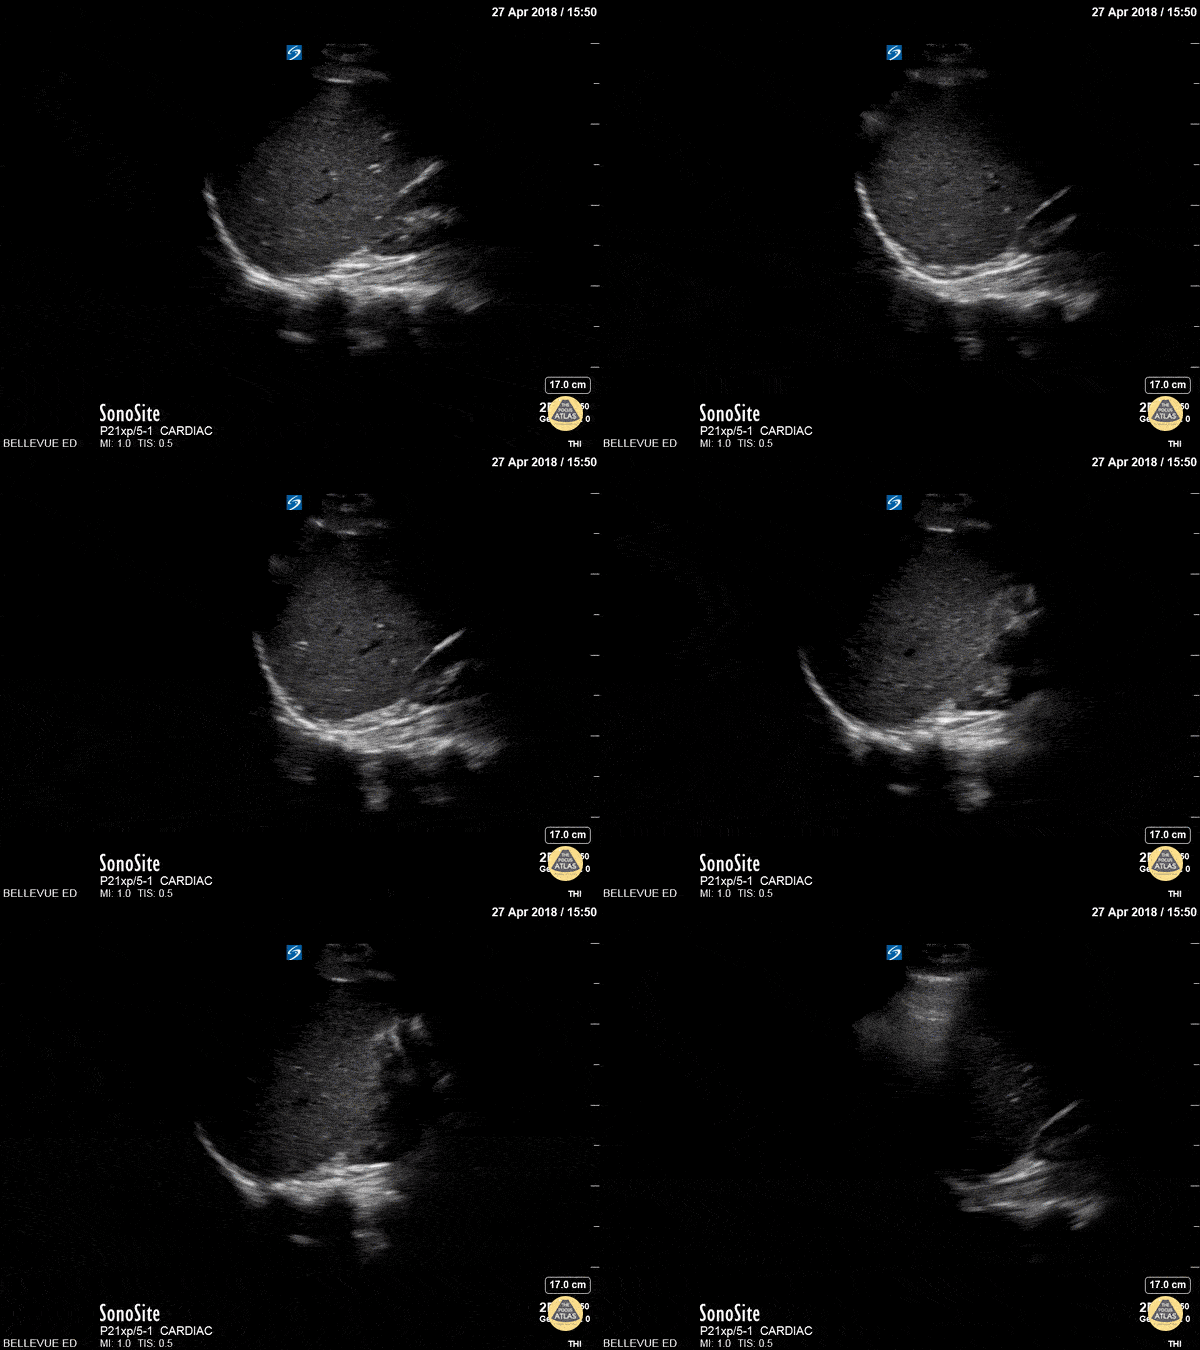
This is a view of the pleural space in the right upper quadrant. We see the isoechoic liver in the center of the screen and the superior pole of the kidney to the right. The superior edge of the liver is flush against the hyperechoic diaphragm.
Deep to all of this we see the sinuate hyperechoic vertebrae of the spine. Note that the spine appears to stop at the level of the diaphragm – this is due to the fact that US waves do not transmit through the air-filled lungs, and is a normal finding. If the spine did extend beyond the diaphragm (“spine sign”) that would suggest the presence of an effusion.
The area above the diaphragm which comes into view when the patient inhales is the same echotexture as the liver (“mirror image artifact”), further indicating that there is only air above the diaphragm and not effusion or consolidation.
Hannah Kopinksi and Dr. Lindsay Davis - NYU Emergency Medicine
Other Lung Ultrasound Pathology
A lines appear as horizontal lines that represent normal aerated lung (dry interlobular septa). They are a reverberation artifact caused by the sound waves bouncing off the highly echogenic pleura and back to the probe, and repeating.
Hannah Kopinski (MS4) and Dr. Lindsay Davis - NYU Emergency Medicine, Matthew Riscinti - Kings County Emergency Medicine
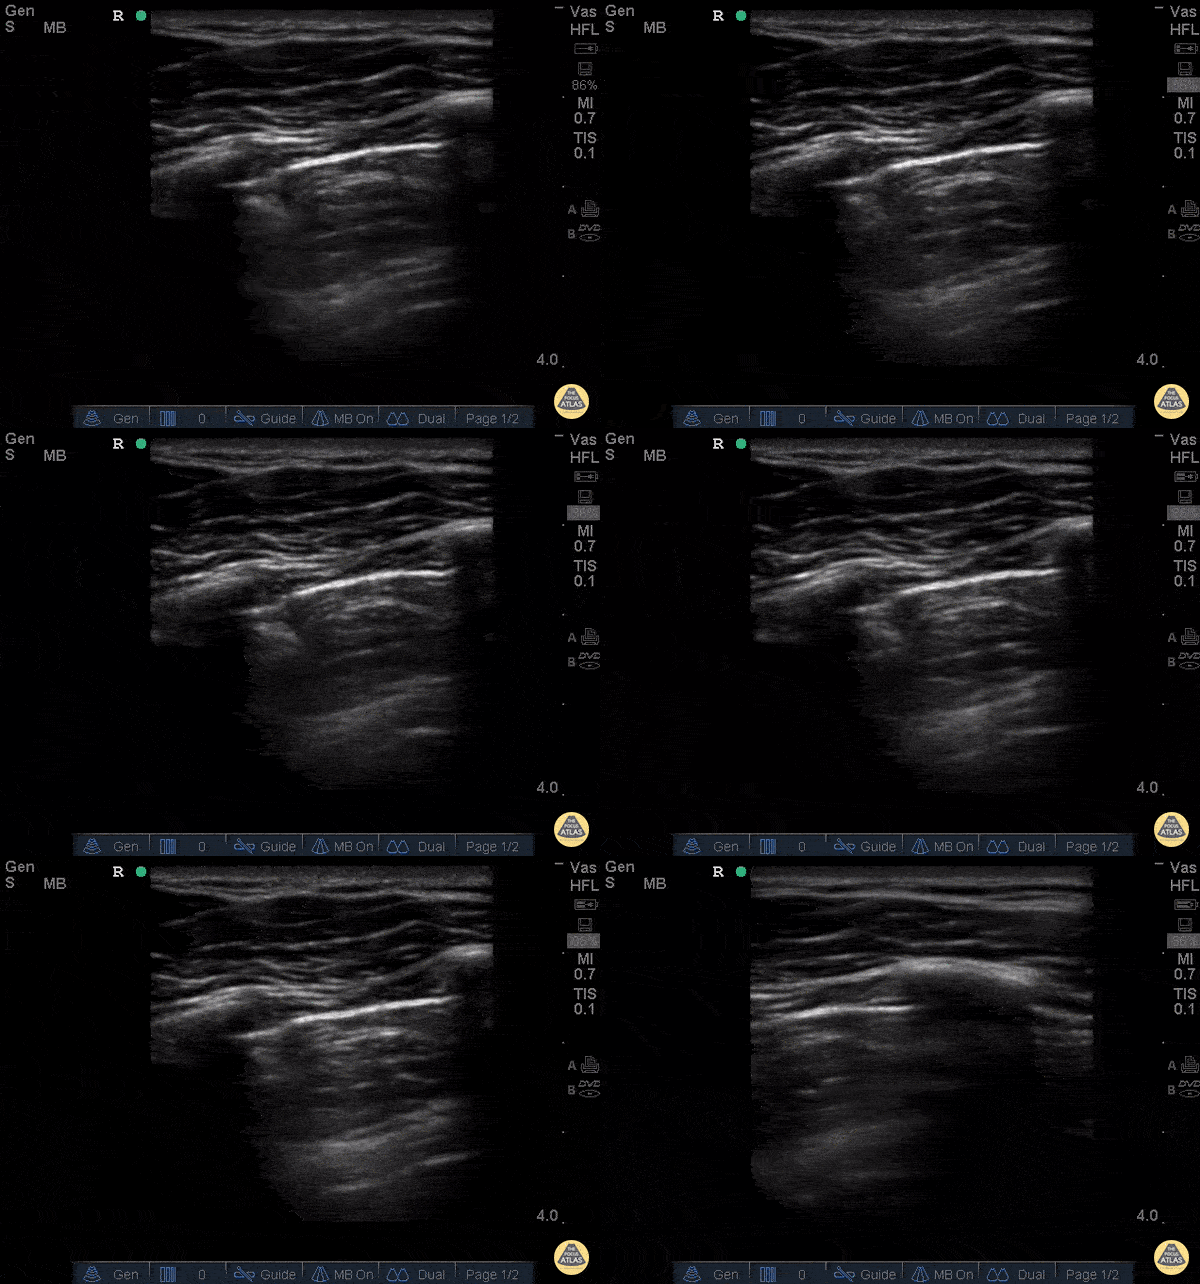
26 yo male presents to ED stating he was kicked in the chest. He went home to “try to relax and smoke some weed” now short of breath and with pleuritic chest pain after smoking. POCUS demonstrating decreased lung slide on the left.
What are the signs of pneumothorax on ultrasound?
Decreased lung sliding - In normal lungs, lung sliding refers to the parietal pleura moving against the visceral pleura - described as “ants marching.”
Lack of B-lines or comet tails – These artifacts will not be present if there is a pneumothorax and the presence of B-lines or comet tails can rule out a pneumothorax.
No Lung pulse – the visceral pleura moving along a stationary parietal pleura due to cardiac motion when lung sliding is not present. These are so called “T lines” on M-mode. These signify that the parietal and visceral pleura are opposing one another and therefore that there is no pneumothorax
Lung point – 100% specific for pneumothorax, this is the cutoff point above which you can appreciate the lung sliding and below which there is no lung sliding. The lung point is the pneumothorax border.
Dr. Stacey Frisch, Dr. John F Kilpatrick - Kings County Emergency Medicine
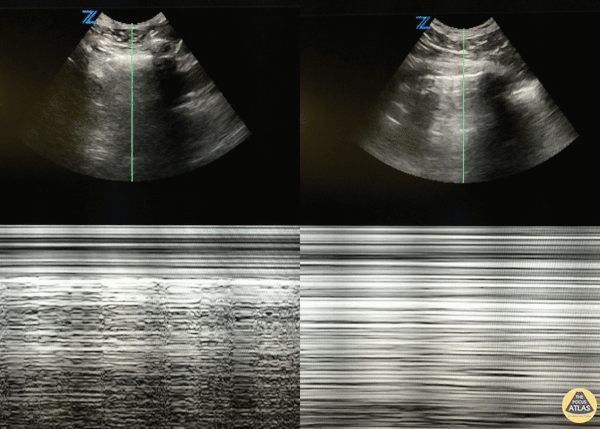
46 y/o M with 20 pack year smoking history with sudden onset right sided chest pain that woke him from sleep. Decreased breath sounds on right side. POCUS with decreased lung slide (right of image) with normal lung slide in left lung (left side of image).
Lung slide can often be appreciated by watching the pleural surfaces move along each other but if you're uncertain, putting the US in m-mode and looking for the classic "seashore sign" (left image) versus the "barcode sign" (right image) can help you figure it out.
Dr. Eric Roseman - Resident Physician, Kings County Emergency/Internal Medicine
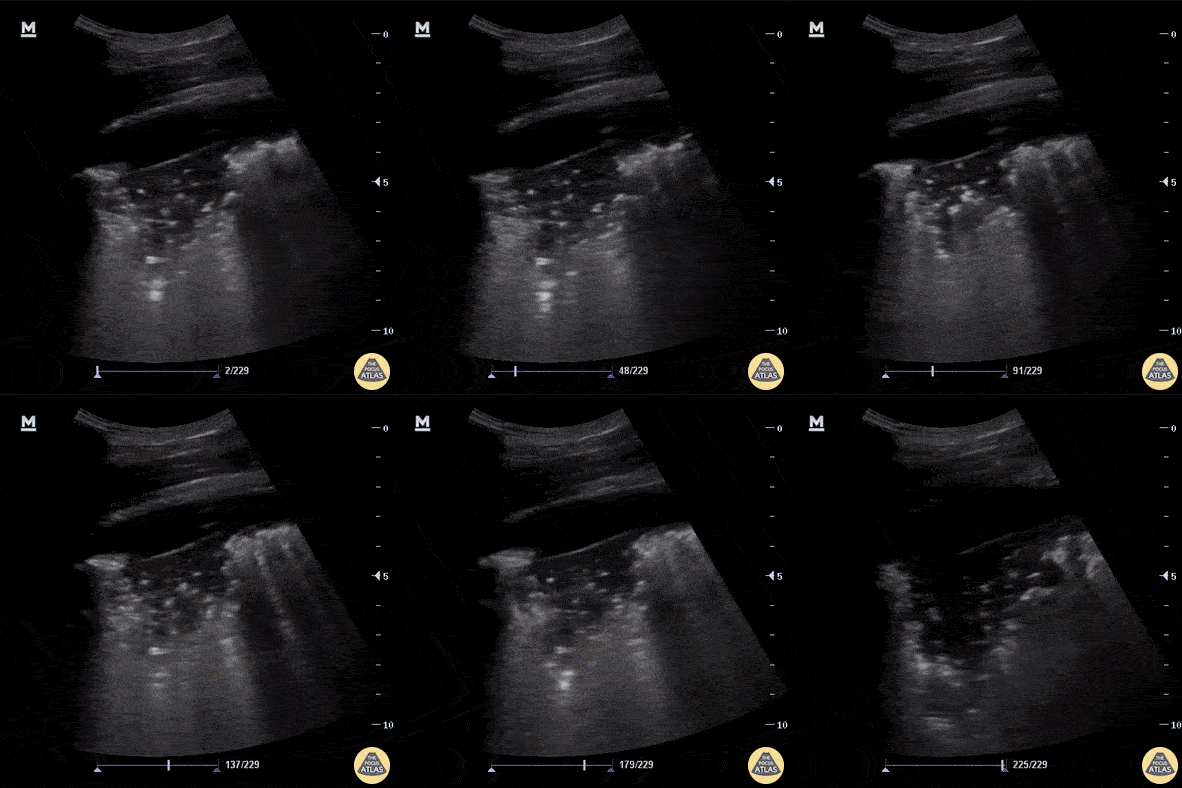
Pictured here are classic ultrasound findings for pneumonia including a shred sign, lung consolidation with dynamic air bronchograms and a small associated parapneumonic effusion. Note also adjacent B-lines.
A shred sign represents the distinction between the consolidated lung and the aerated lung and is seen in this clip as the irregular “shredded” border just posterior to the consolidation.
Aaron Inouye, PA-C, North Canyon Medical Center
@PAintheED
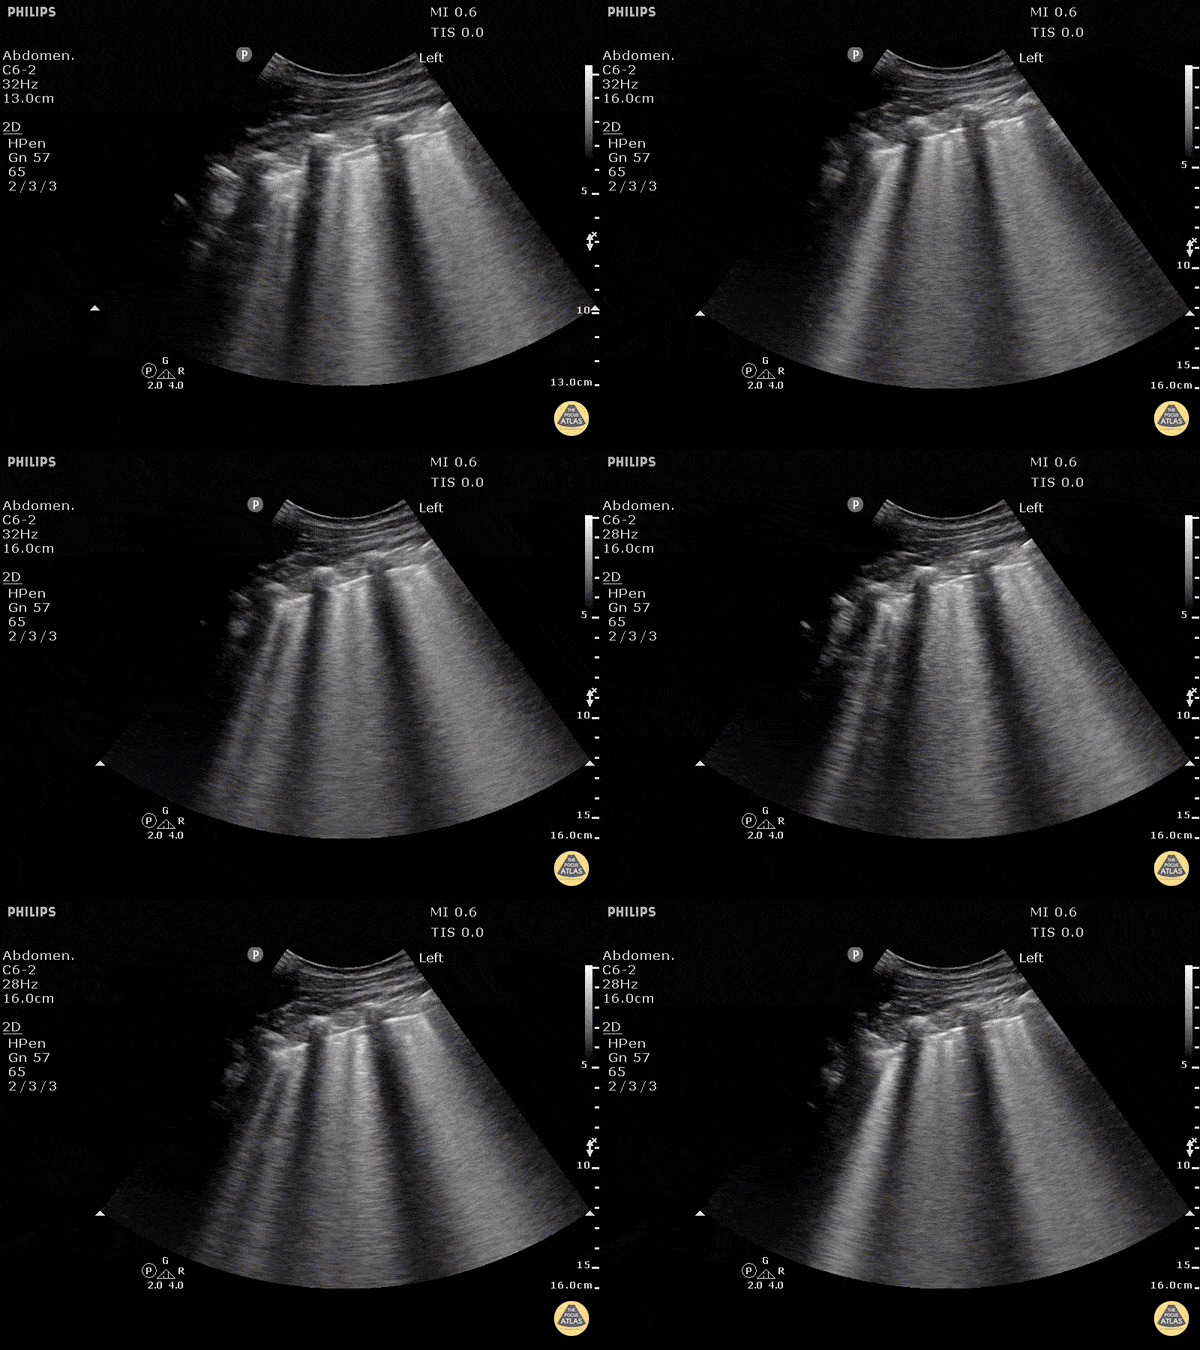
B-lines obtained with curved probe.
B-lines are vertical artifacts that move with respiration from the pleural surface. They represent increased water in an area of the lung. In the right clinical context this could represent pulmonary edema. An increase in B-lines correlates with the degree of pulmonary edema.
3 B-lines in an intercostal space represent a "positive" region of the lung, and if there are two regions of the lung that are positive, you can diagnose pulmonary edema.
Dr. Justin Bowra et al. (Dr. D Browne and Dr. J Knights)
WCUME 2017 Submission for "Best POCUS"
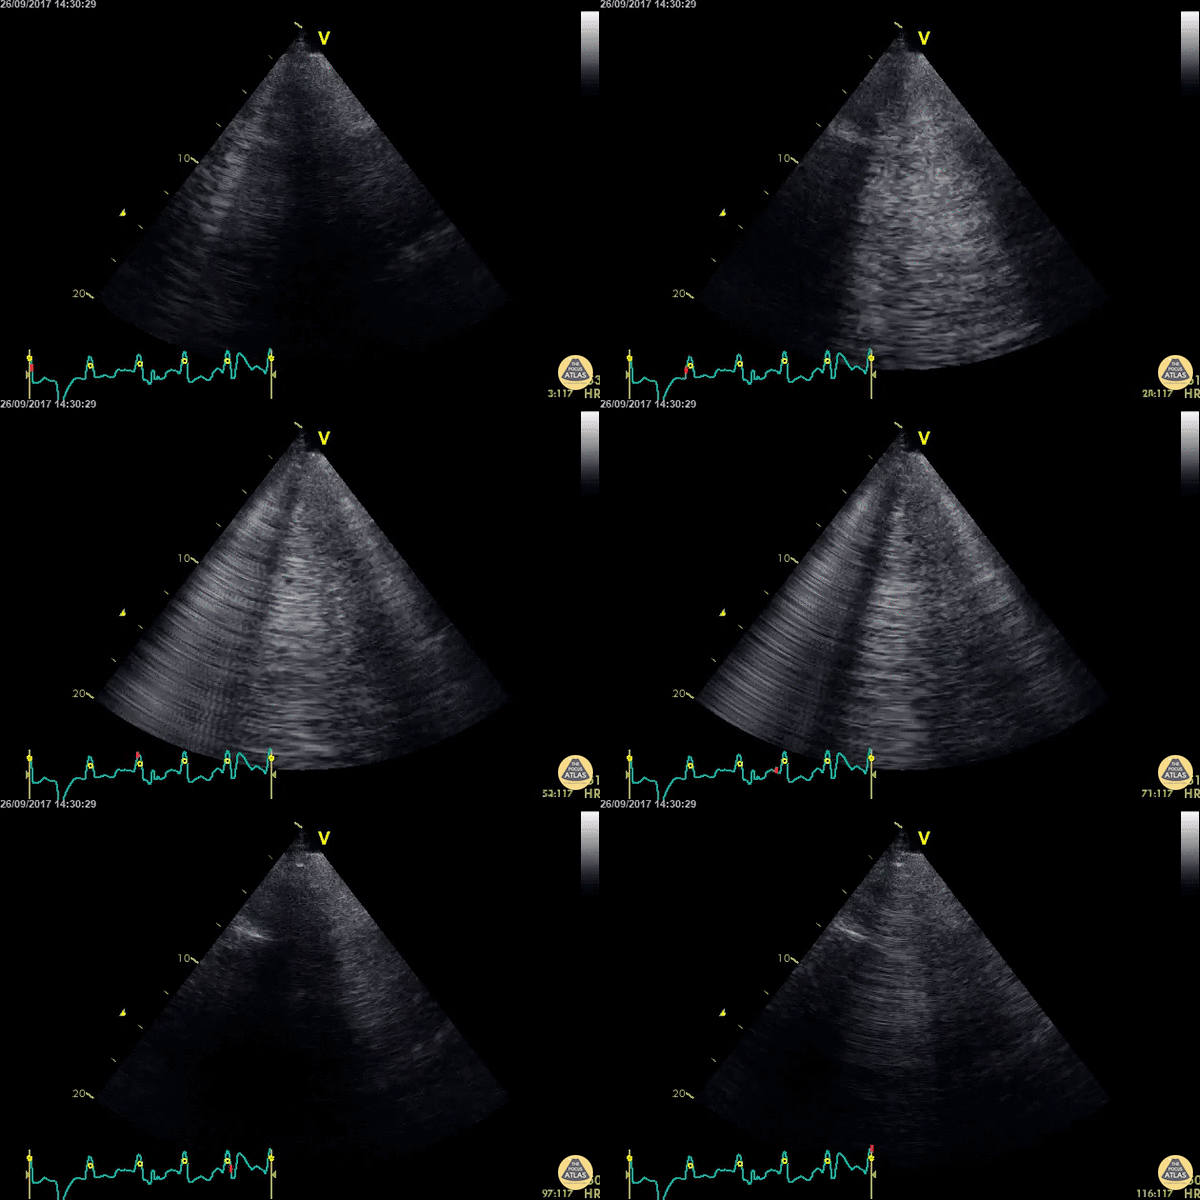
An acutely dyspnoeic patient presents with ventricular tachycardia and has no response to initial chemical cardioversion. Lung POCUS shows widespread bilateral confluent B lines indicating acute pulmonary edema. Unstable tachycardia terminated using synchronized electrical cardioversion.
Dr. Cian McDermott - Dublin, Ireland
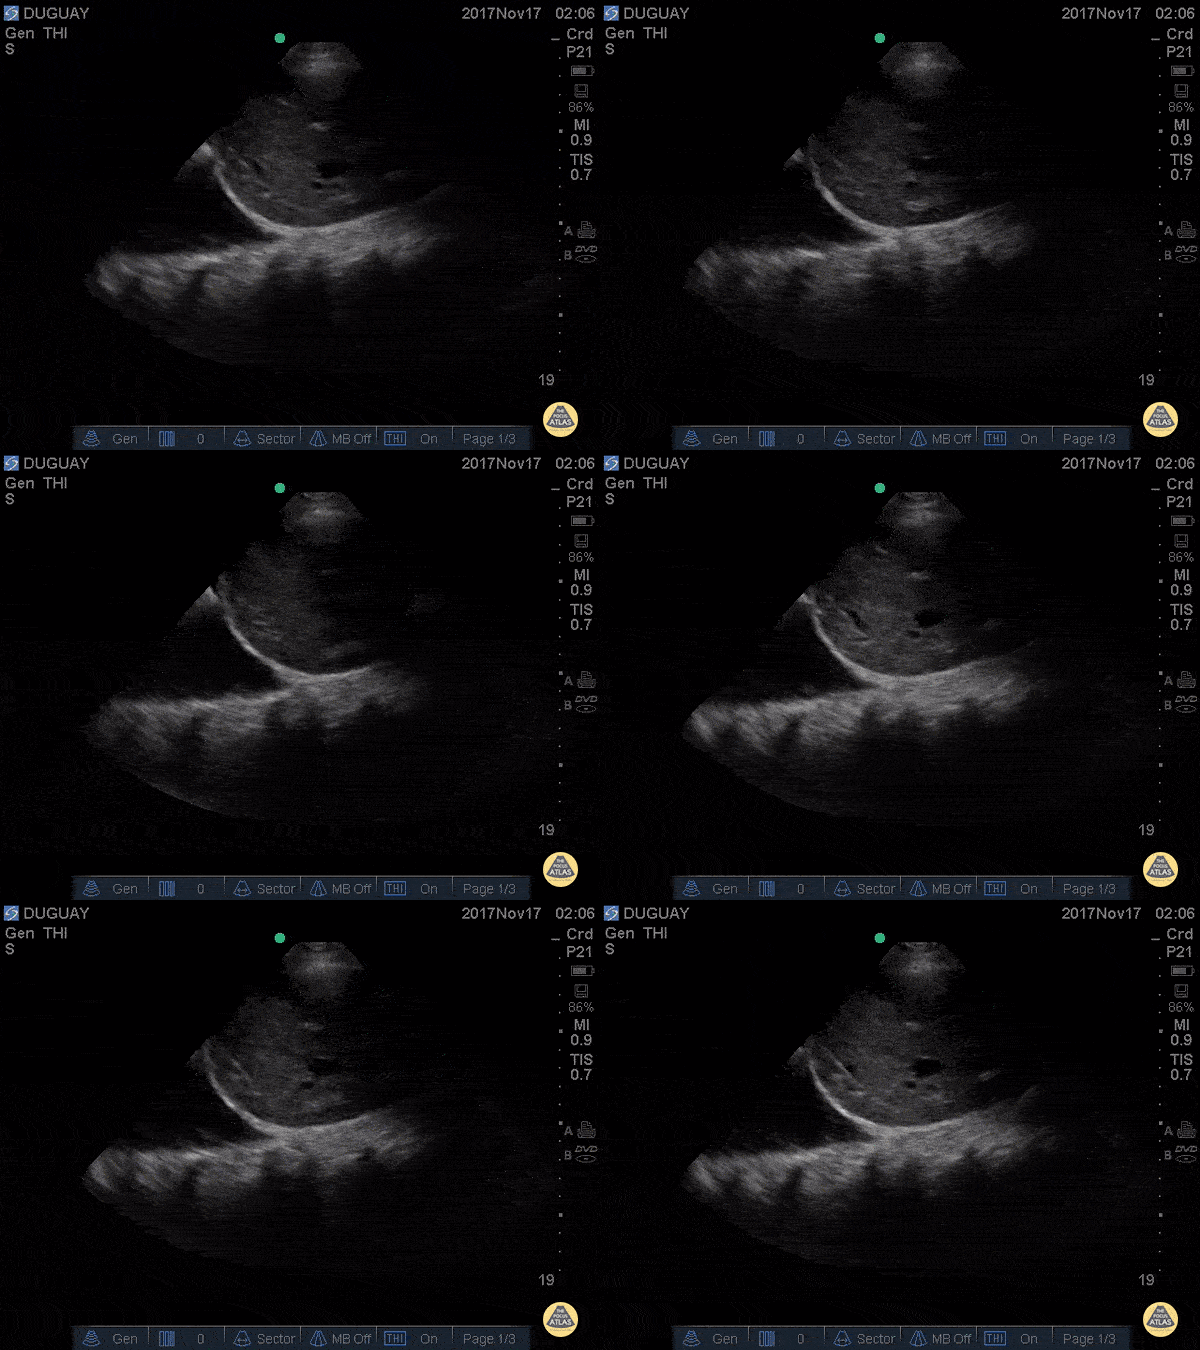
RUQ scan with large R pleural effusion. Spine sign+ (clear view of several thoracic vertebrae through the effusion)
Gary Duguay
WCUME 2017 Submission for "Creative Caption"
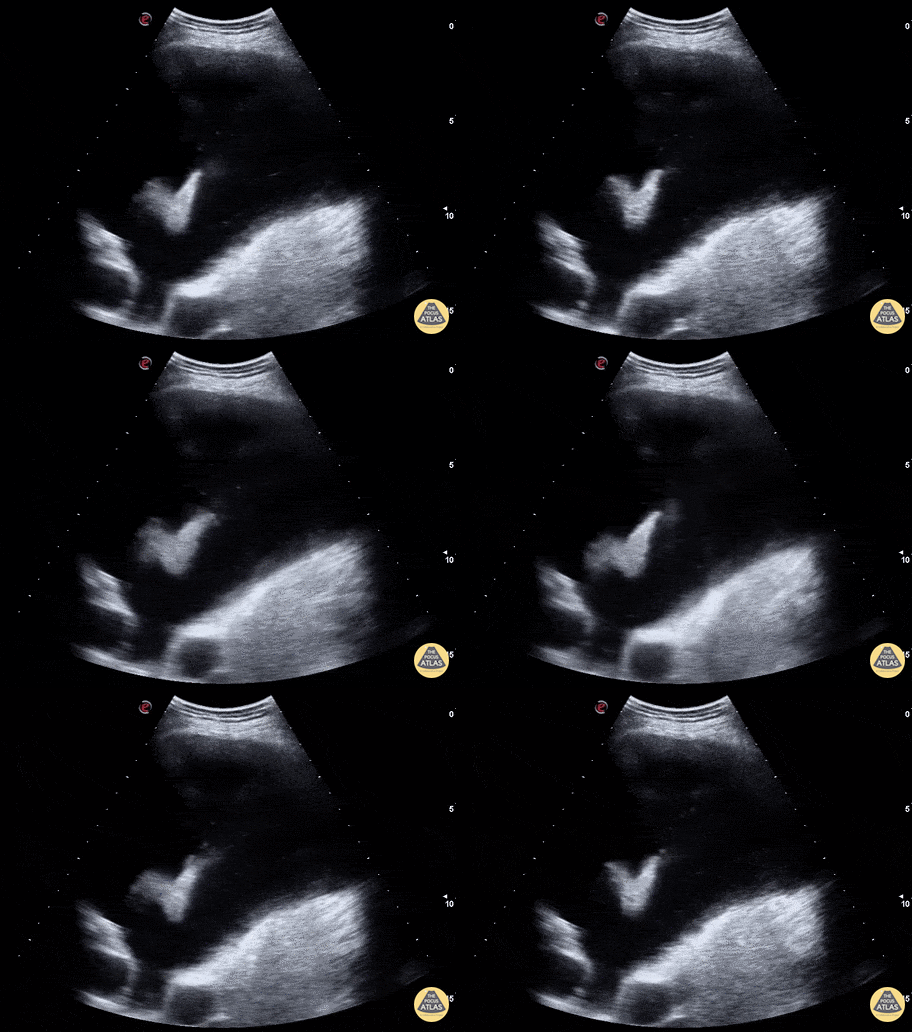
"In these days of violent extremist and warmongers, can it be a a good omen to find a dove flying in the pleural fluid?"
Marco Garrone, MD - Torino, Italy
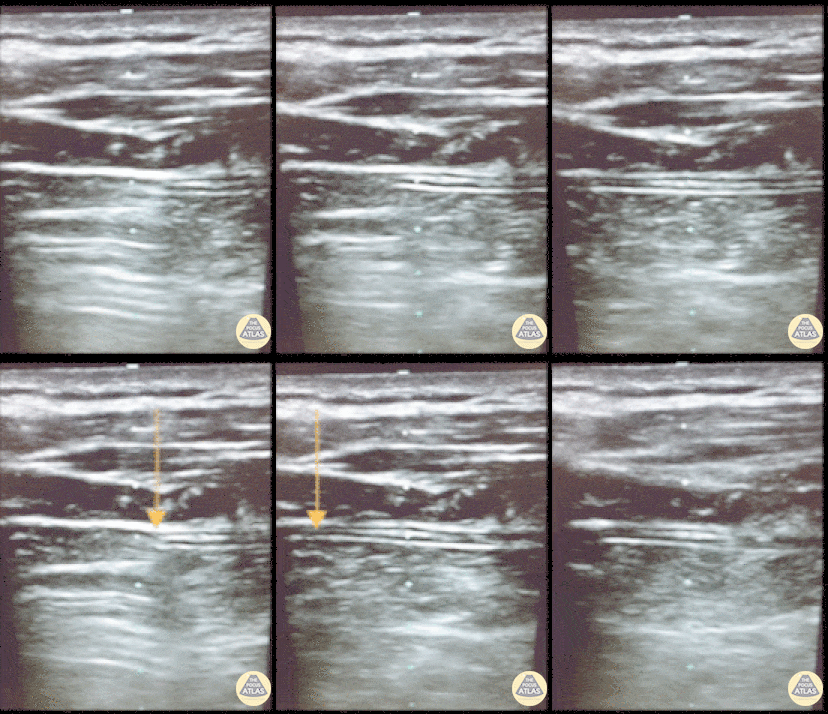
This is an image of a patient's chest wall using a high frequency transducer, with the transducer oriented in a transverse plane between rib spaces. The patient had a pneumothorax and a chest tube was placed. This clip illustrates what happens when the suction is turned 'on'. You will see the pleura slide from right to left as the pneumothorax resolves.
- Jason Tanguay, DO; Ultrasound Leadership Academy Graduate
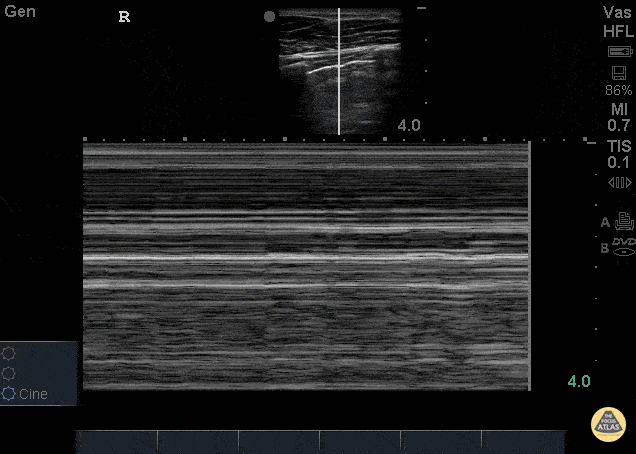
26 yo male presents to ED stating he was kicked in the chest. He went home to “try to relax and smoke some weed” now short of breath and with pleuritic chest pain after smoking. POCUS demonstrating decreased lung slide on the left.
This can be seen as decreased lung sliding - In normal lungs, lung sliding refers to the parietal pleura moving against the visceral pleura - described as “ants marching.” M-mode can be used to evaluate lung sliding. Remember, normal lung slide will look like a seashore on M-mode whereas a pneumothorax will appear as horizontal lines termed Bar Code sign (pictured here). Make sure to check in the most anterior fields as well at lateral lung fields.
Dr. Stacey Frisch, Dr. John F Kilpatrick - Kings County Emergency Medicine
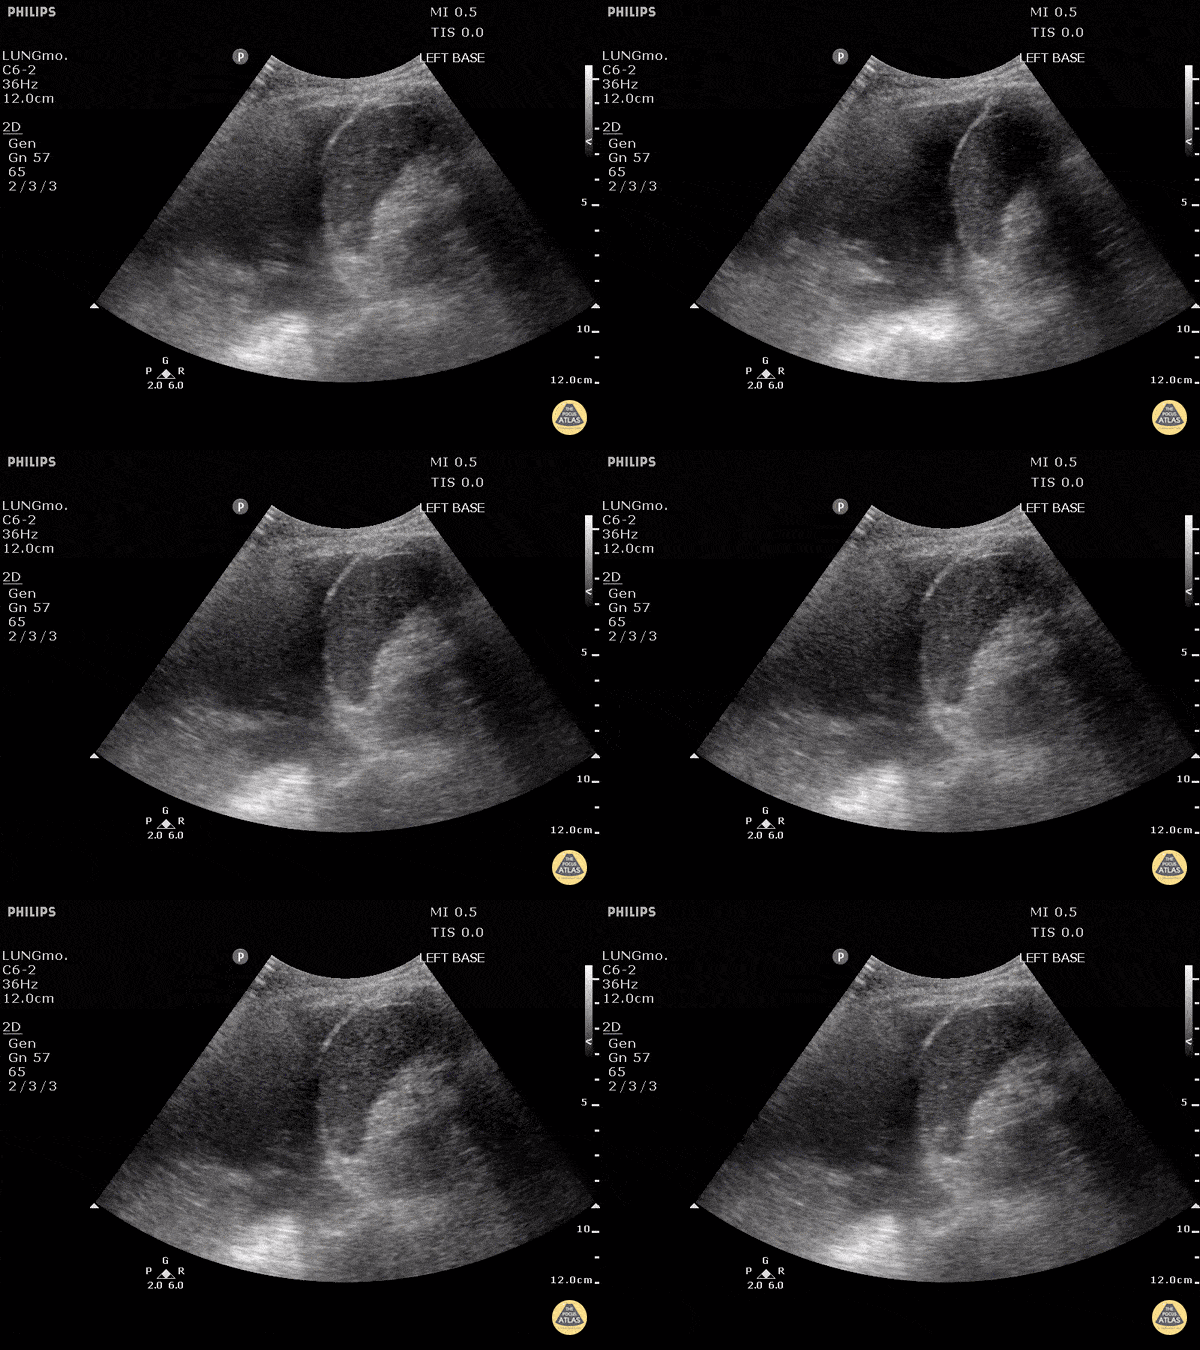
The left lung can be seen freely floating in anechoic fluid on the left side of the screen. Also pictured, the diaphragm, spleen, and edge of the beating heart.
Justin Bowra MBBS, FACEM, CCPU Emergency Physician, RNSH
et al.
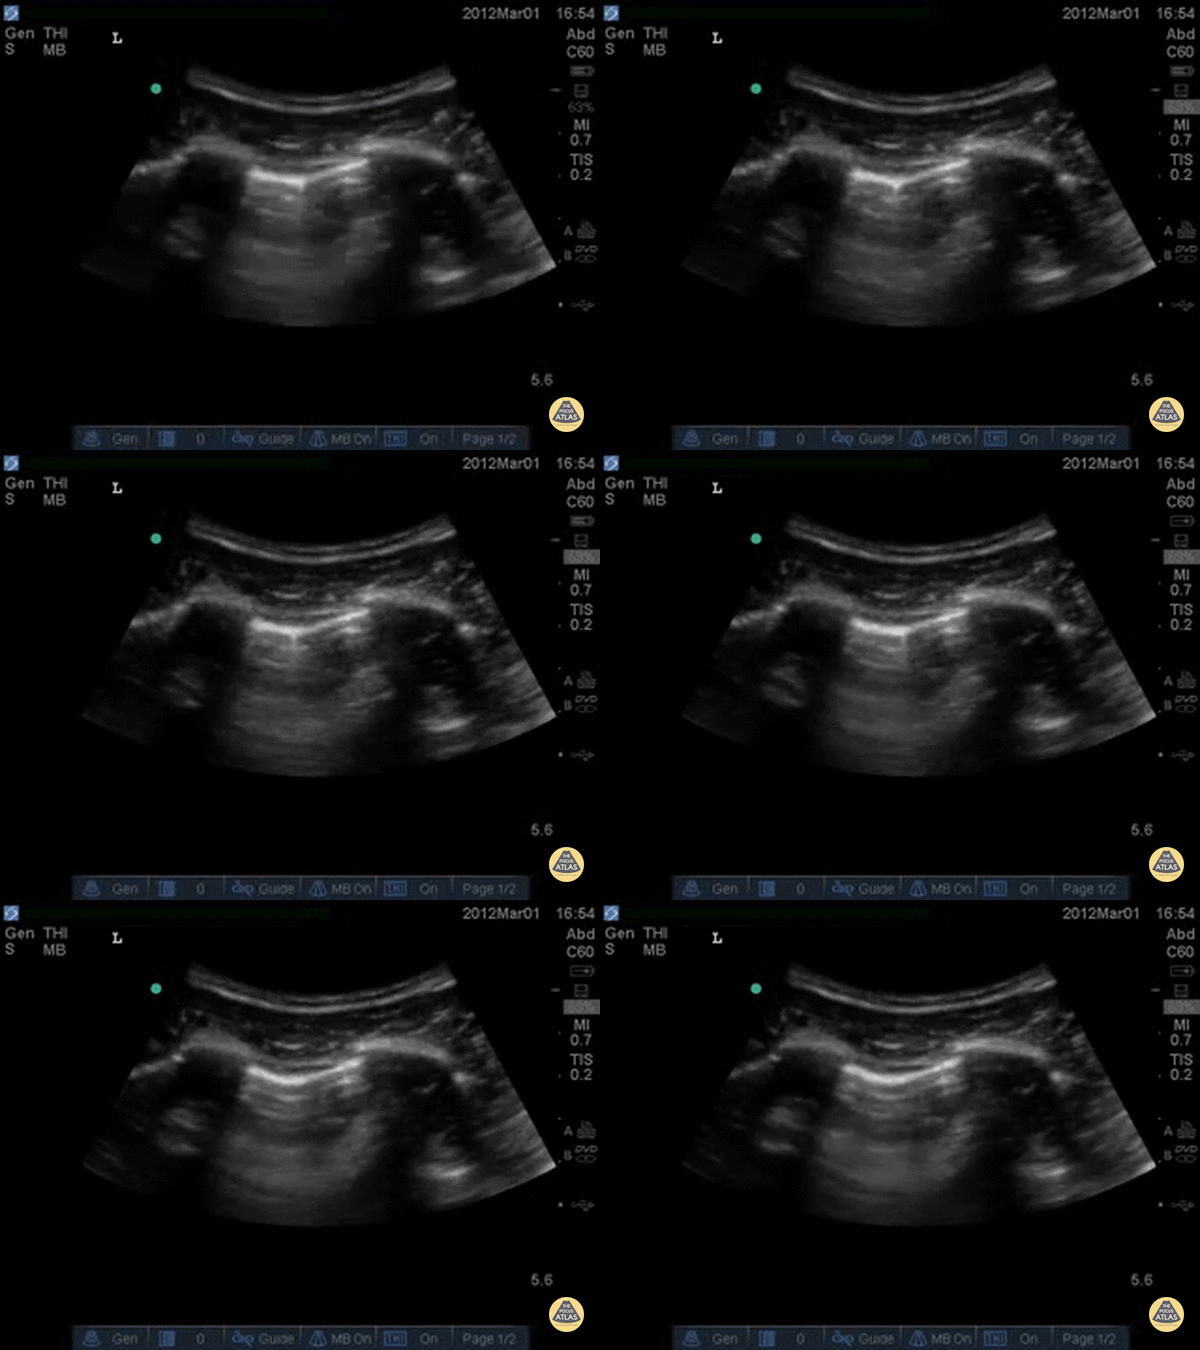
Decreased lung slide is highly sensitive, it lacks specificity. Lung point however, is a highly specific finding indicating a pneumothorax.
Lung point indicates the transition point between normal pleura with normal lung sliding and where there is air disrupting the pleural space with decreased lung sliding.
In this intercostal space, one can see lung with normal lung slide on the left, and decreased lung slide on the right, and a point where the lung slide changes, which is moving with inspiration. This is the lung point.
Dr. Justin Bowra et al.
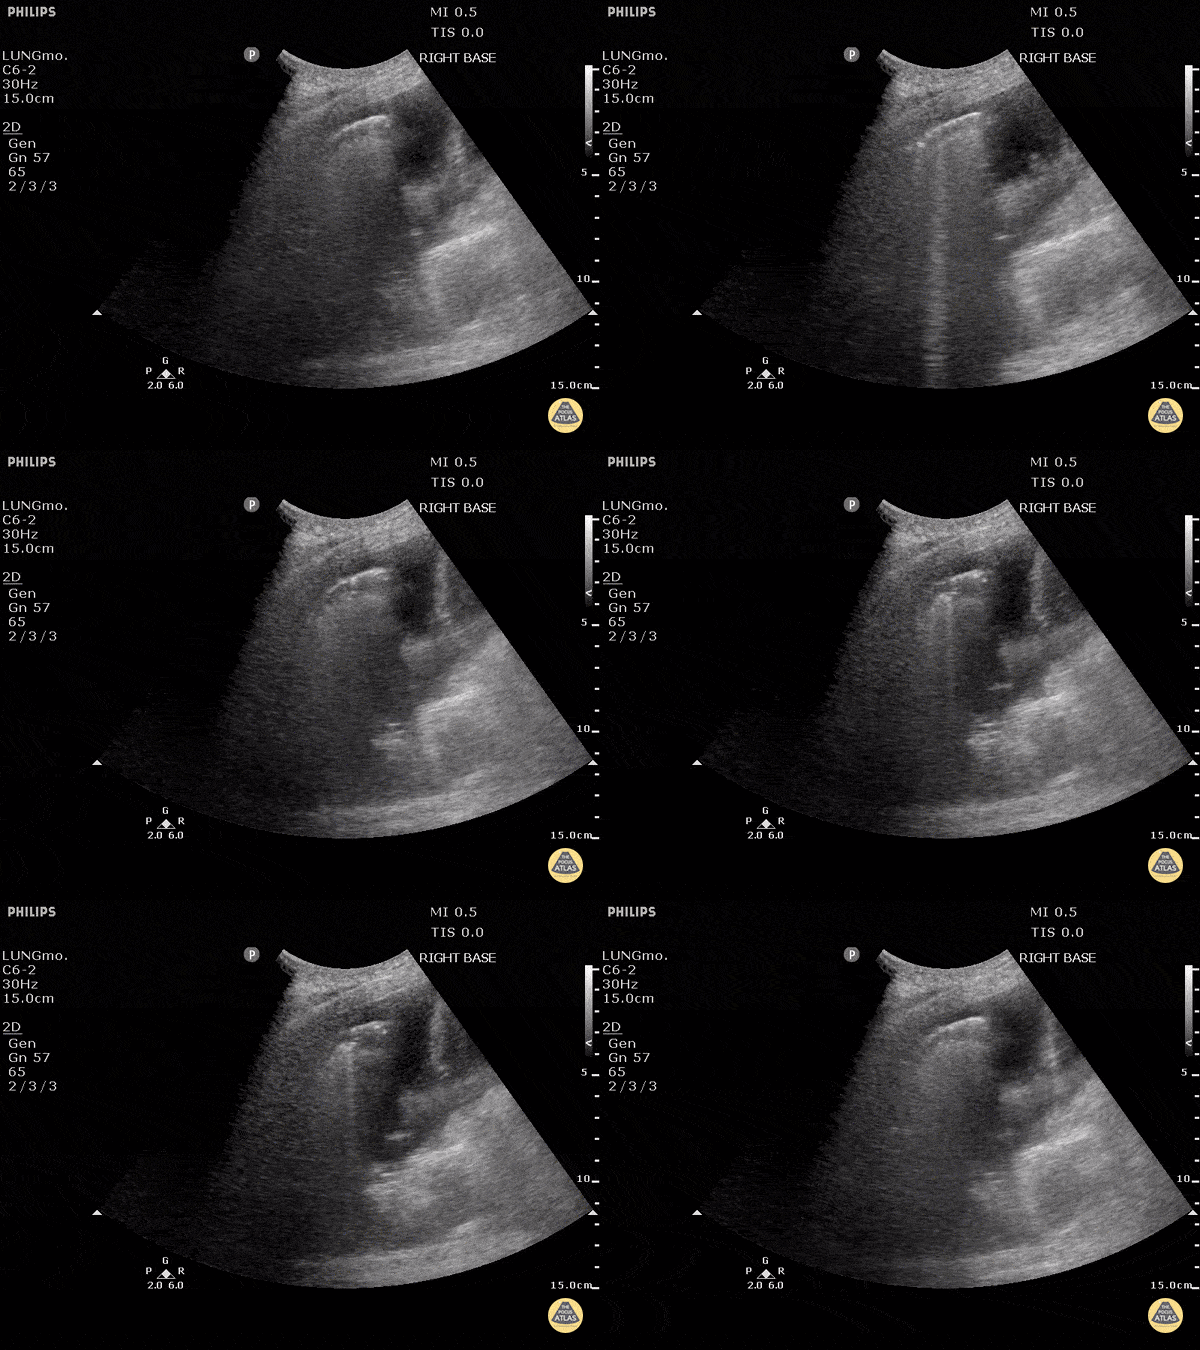
To the left of the image, the lung can be seen clearly floating in anechoic fluid representing a pleural effusion.
B-Lines can be seen radiating from the surface of the lung to the far left especially as this patient inspired.
B lines (also known as comet tails) are white lines that emanate from the pleural surface of the lung. They have been shown to be highly sensitive for pulmonary edema.
Justin Bowra MBBS, FACEM, CCPU Emergency Physician, RNSH
et al.
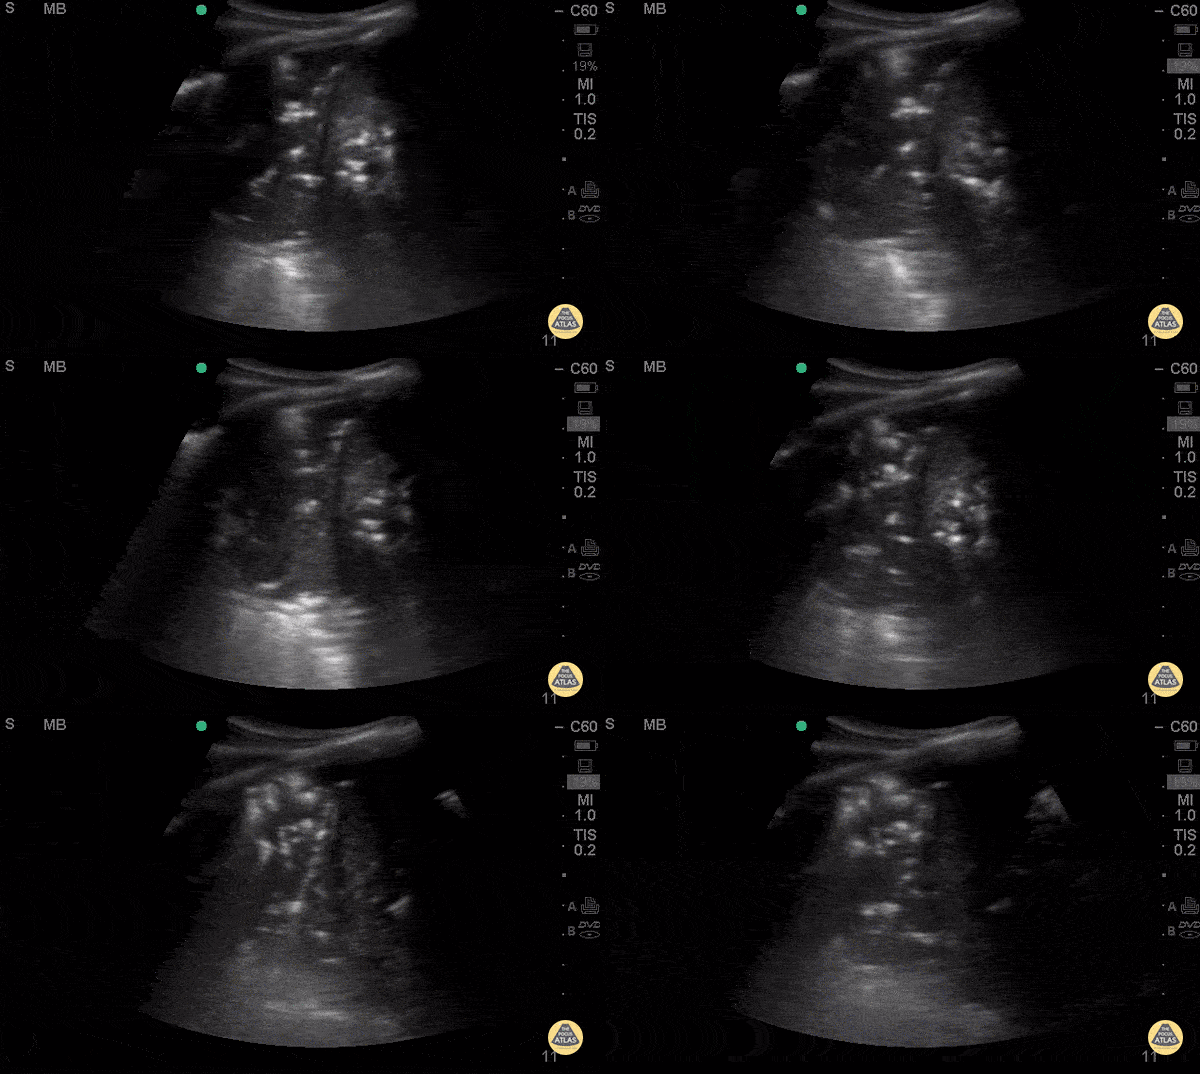
Middle aged female with history of HIV, asthma, and polysubstance use who presents with progressively worsening dyspnea over 3-4 days, found to have diffuse rales, worse in left mid to lower lung fields. AP CXR with bilateral lower lobe patchy infiltrate, left greater than right.
POCUS with curvilinear probe revealed B lines in left mid lung fields and consolidation with air
bronchograms in left lower lung. Air bronchograms is one of the most specific signs for the diagnosis of pneumonia with a specificity (93%) and a positive LR (12.14). Ultimately, CT chest is the gold standard for diagnosis of pneumonia, which was consistent with the CT in this patient.
Priscilla Chao, MD, Matthew Riscinti, MD - Kings County Emergency Medicine
Infection Control During the COVID-19 Pandemic
EPA List of Disinfectants for Use Against SARS-CoV-2
Denver Health COVID-19 Portable Ultrasound Workflow
ACEP Ultrasound Section COVID-19 Cleaning Protocol
Using Probe Cover for Butterfly iQ + iPhone from Mike Stone
Learn More About POCUS in COVID-19

POCUS in COVID-19 via Ultrasound GEL. Michael Pratt sits down with Mike Mallin to discuss the most recent evidence regarding POCUS use in COVID-19 patients.

POCUS Use in Patients with Suspected COVID-19 via Core Ultrasound. Mike Mallin and Jacob Avila talk with Michael Prats and Mike Stone on how ultrasound can be used to help manage your patients with suspected COVID.


Comprehensive resource page on use of bedside ultrasound in suspected COVID-19 patients tailored towards Butterfly iQ use.


The Ultrasound Leadership Academy is offering a free point of care lung ultrasound learning module!
References
Peng, Q., Wang, X. & Zhang, L. Findings of lung ultrasonography of novel corona virus pneumonia during the 2019–2020 epidemic. Intensive Care Med (2020). Link
Huang, Yi and Wang, Sihan and Liu, Yue and Zhang, Yaohui and Zheng, Chuyun and Zheng, Yu and Zhang, Chaoyang and Min, Weili and Zhou, Huihui and Yu, Ming and Hu, Mingjun, A Preliminary Study on the Ultrasonic Manifestations of Peripulmonary Lesions of Non-Critical Novel Coronavirus Pneumonia (COVID-19) (February 26, 2020). Link
Ai T, Yang Z, Hou H, Zhan C, Chen C, Lv W, Tao Q, Sun Z, Xia L. Correlation of Chest CT and RT-PCR Testing in Coronavirus Disease 2019 (COVID-19) in China: A Report of 1014 Cases. Radiology 2020. doi: 10.1148/radiol.2020200642 Link
Wang D, Hu B, Hu C, et al. Clinical Characteristics of 138 Hospitalized Patients With 2019 Novel Coronavirus–Infected Pneumonia in Wuhan, China. JAMA. 2020;323(11):1061–1069. doi:10.1001/jama.2020.1585 Link
Soldati, G., Smargiassi, A., Inchingolo, R., Buonsenso, D., Perrone, T., Briganti, D.F., Perlini, S., Torri, E., Mariani, A., Mossolani, E.E., Tursi, F., Mento, F. and Demi, L. (2020), Proposal for international standardization of the use of lung ultrasound for COVID‐19 patients; a simple, quantitative, reproducible method. J Ultrasound Med. Accepted Author Manuscript. doi:10.1002/jum.15285 Link